Findings

In this JPMorgan Chase Institute report on financial markets, we use the mid-2013 taper tantrum episode to elucidate interactions between market movements and institutional investor behavior around a major monetary policy shock, focusing on spillovers to emerging market (EM) currencies. We study the taper tantrum because it represents a key episode in the post-financial crisis use of large-scale asset purchases (LSAPs). Given the sustained low level of interest rates over the past decade, these measures have become an indispensable part of the modern central banking policy toolkit; however, policymakers’ imperfect knowledge of market participant expectations and potential responses to policy adjustment has meant that these programs have been challenging to unwind smoothly.

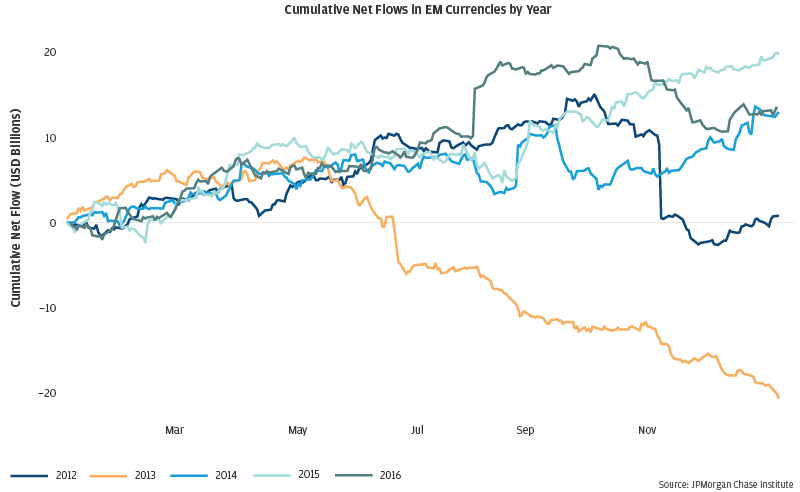
Using the unique data available to the Institute, we document how investor behavior changed starkly around the onset of the taper tantrum, as flows from market participants that on-net were buying EM currencies began to reverse. In addition, we leverage the granular nature of the data to help answer the following three questions in the taper tantrum context:

  1. Which market elements—news, liquidity, and net flows—best explain EM FX market performance?
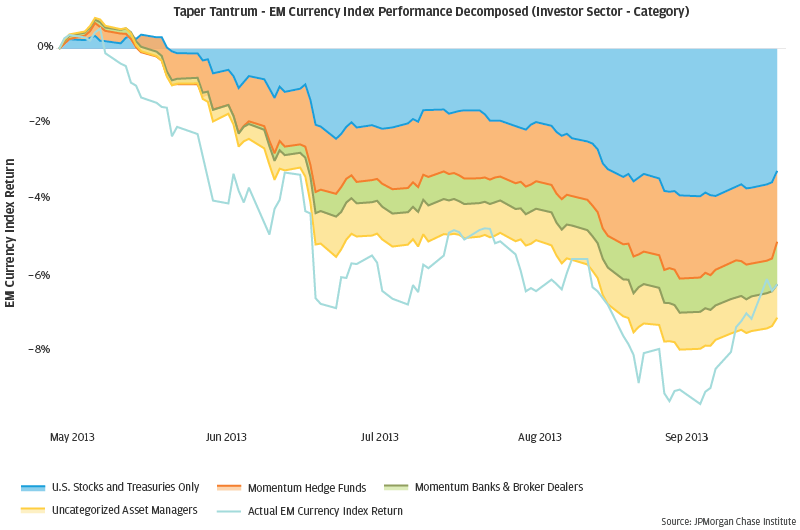
  2. Do particular groups of market participants drive the overall link between flows and market changes? If so, which groups?
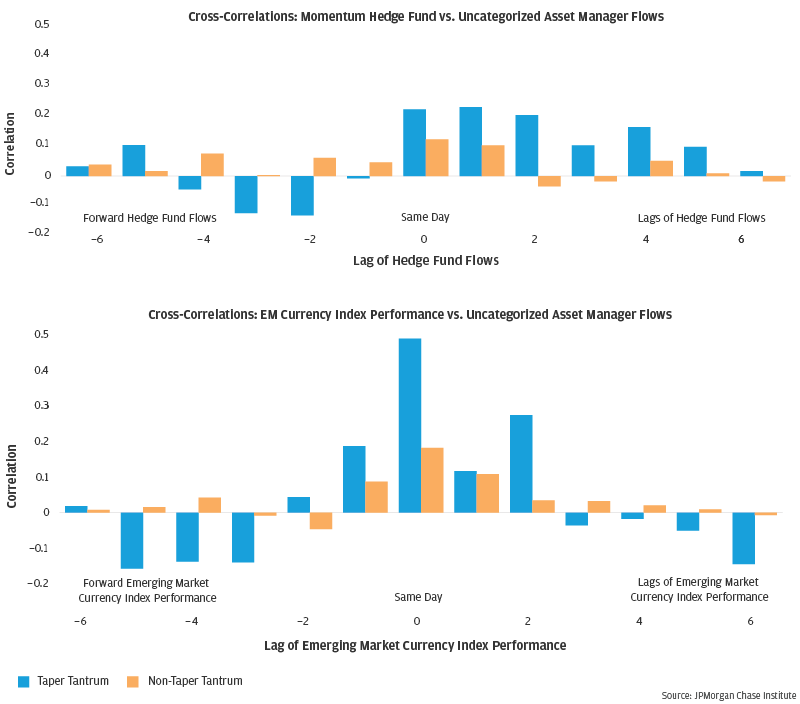
  3. Did herding activity play a role in price action and net flow changes?

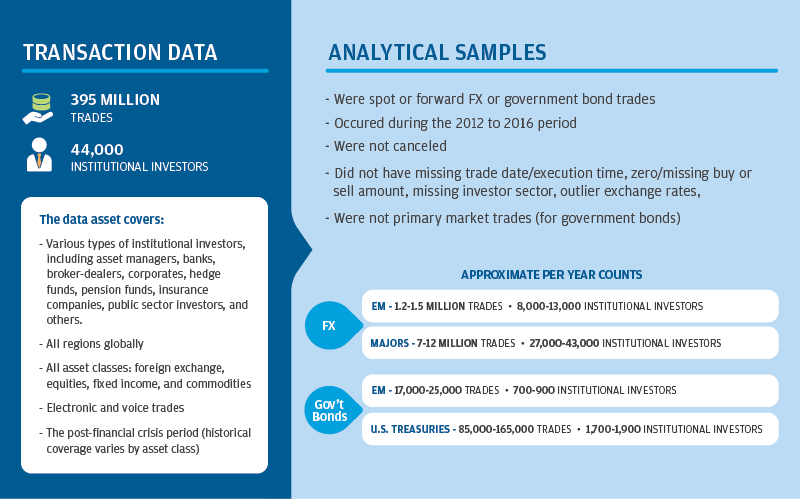
Answers to these questions, grounded in new data (summarized in the graphic below), provide insight into how the taper tantrum period unfolded in EM currency markets and offers more general lessons on the potential role of investor behavior in contributing to large market swings. Accordingly, we organize our research around three findings described in the following pages. The taper tantrum represents a key episode in the post-financial crisis use of large-scale asset purchases.

Infographic describing data used for this report.

Transaction Data is made up of 395 million trades and 44,000 institutional investors.

The data asset covers: various types of institutional investors, all regions globally, all asset classes (foreign exchange, equities, fixed income, and commodities, electronic and voice trades), and the post-financial crisis period (historical coverage varies by asset class)

Analytical Samples: Were spot or forward FX or government bond trades, occurred during the 2012 to 2016 period, were not cancelled, did not have missing trade date/execution time, zero/missing buy or sell amount, missing investor sector, outlier exchange rates, were not primary market trades (for government bonds)

The following four events are examined: FX EM: 1.2-1.5 million trades and 8,000-13,000 Institutional investors, FX Majors: 7-12 million trades and 27,000-43,000 institutional investors, EM: 17,000-25,000 trades and 700-900 institutional investors, Government Bonds and U.S. Treasuries: 85,000-165,000 trades and 1,700-1,900 institutional investors

Source: JPMorgan Chase Institute

01

Net flows have substantial predictive power for EM FX and government bond market performance. The relationship between EM currency performance and flows is conditional on the degree of market liquidity, and depreciation during the taper tantrum was correlated with selling pressure from subsets of market participants.

Line graph shows Cumulative Net Flows In EM Currencles by Year

Line chart showing the months of March through November with lines showing cumulative net flows in EM Currencies for each of the years of 2012-2016. A sharp reversal in aggregate flows is seen in May 2013 lasting through year-end, coinciding closely with the onset of the taper tantrum, as compared to surrounding years.

Source: JPMorgan Chase Institute

Over the post-crisis period we study, our net flow data—disaggregated at the investor sector level—can explain substantial portions of the variation in EM FX and government bond markets. The boost to explanatory power (R-squared) from including net flows in regressions of these EM assets ranges from 25 to over 50 percent, depending on context, relative to the combined forecasting ability of U.S. equities and Treasury yields. Focusing on EM currencies, where our data are finer, we also find time variation in the relationship between net flows and EM currency index changes. In particular, asset manager sales of EM currencies are associated with a considerably larger depreciation than normal when liquidity is low. A sharp reversal in aggregate flows seen in our data in May 2013—coinciding closely with the onset of the taper tantrum—suggests a role for market participant transactions in contributing to the extent of depreciation during the episode.

01

The explanatory power of flows during the taper tantrum can be accounted for by a relatively small subset of active market participants associated with momentum and a broad set of asset managers that typically do not exhibit strong systematic behavior.

Line graph: Taper Tantrum—EM Currency Index Performance Decomposed (Investor Sector - Category)

Stacked line chart showing EM currency index performance decomposed by investor sector category. The stacked time series displays, ordered by descending explanatory power, U.S. stocks and treasury only, momentum hedge funds, momentum banks and broker dealers, and uncategorized asset managers’ contributions in explaining EM currency index depreciation.

Source: JPMorgan Chase Institute

To supplement our sector-level flows, we employ a parsing of market participants according to readily-observable systematic patterns in their transactions to understand the nature of the close connection evident between certain sectors’ flows and market movements. In a key result, we identify relatively small pockets of the investor base—namely, hedge funds and banks associated with momentum trading—that appear to drive much of the explanatory power of net flows. Moreover, the transactions of asset managers that typically do not exhibit strong systematic patterns changed their behavior during the taper tantrum and became highly correlated with EM currency depreciation. To see how these three pockets of the investor base may have contributed to price action during the taper tantrum, we use our newly-derived investor archetypes (categorized using out-of-sample data) in a regression of EM currency performance over 2013. As depicted in the figure below, the predicted contributions to price action of flows from these market participants line up well with market dynamics and can account for much of the cumulative taper tantrum depreciation in excess of what would be predicted by U.S. market movements alone.

01

During the taper tantrum, linkages between certain market participants’ flows and price action appeared to increase, reflecting potential herding behavior that had a significant impact on prices.

Bar graph: Cross-Correlations: Momentum Hedge Fund vs. Uncategorized Asset Manager Flows and Bar graph2 describes about Cross-Correlations: EM Currency Index Performance vs. Uncategorized Asset Manager Flows

Two bar charts showing correlation between a large subset of asset manager flows (uncategorized asset managers) and (i) momentum hedge funds and (ii) EM currency index performance during and outside of the taper tantrum. During the taper tantrum, uncategorized asset managers’ transactions became more highly correlated with momentum hedge funds and contemporaneous price action. Additionally, the bar chart of momentum hedge funds and uncategorized asset managers shows that flows of the latter tracked the former with a few days’ lag, suggesting a leader-follower dynamic during the taper tantrum.

Source: JPMorgan Chase Institute

During the taper tantrum, the transactions of a large subset of asset managers became more highly correlated with other investor categories and contemporaneous price action. Additionally, we find evidence that asset managers tracked the flows of hedge funds associated with momentum with a lag of a few days, suggesting a leader-follower dynamic that does not typically appear. To illustrate more closely the temporal dimension of these relationships, we plot (in the figure below) the correlation between asset managers and both hedge fund flows and price action with various leads and lags. A few observations stand out: first, the transactions of asset managers tracked lagged hedge fund flows but not the other way around; and second, the contemporaneous flow-flow and flow-price correlations were notably higher than usual during the taper tantrum (we test that this is not just a function of the change in volatility during the episode).

Finally, key flash points of EM currency depreciation during the taper tantrum were associated with sharp (negative) outliers in the number of buyers versus sellers of EM currencies in our data, which further points to herding activity that potentially affected market dynamics.

Authors

Diana Farrell

Diana Farrell

Founding and Former President & CEO

George Eckerd

George Eckerd

Financial Markets Research Lead

Chen Zhao

Chen Zhao

Housing Finance Research Lead

Melissa O’Brien

Melissa O’Brien

Data Science Lead