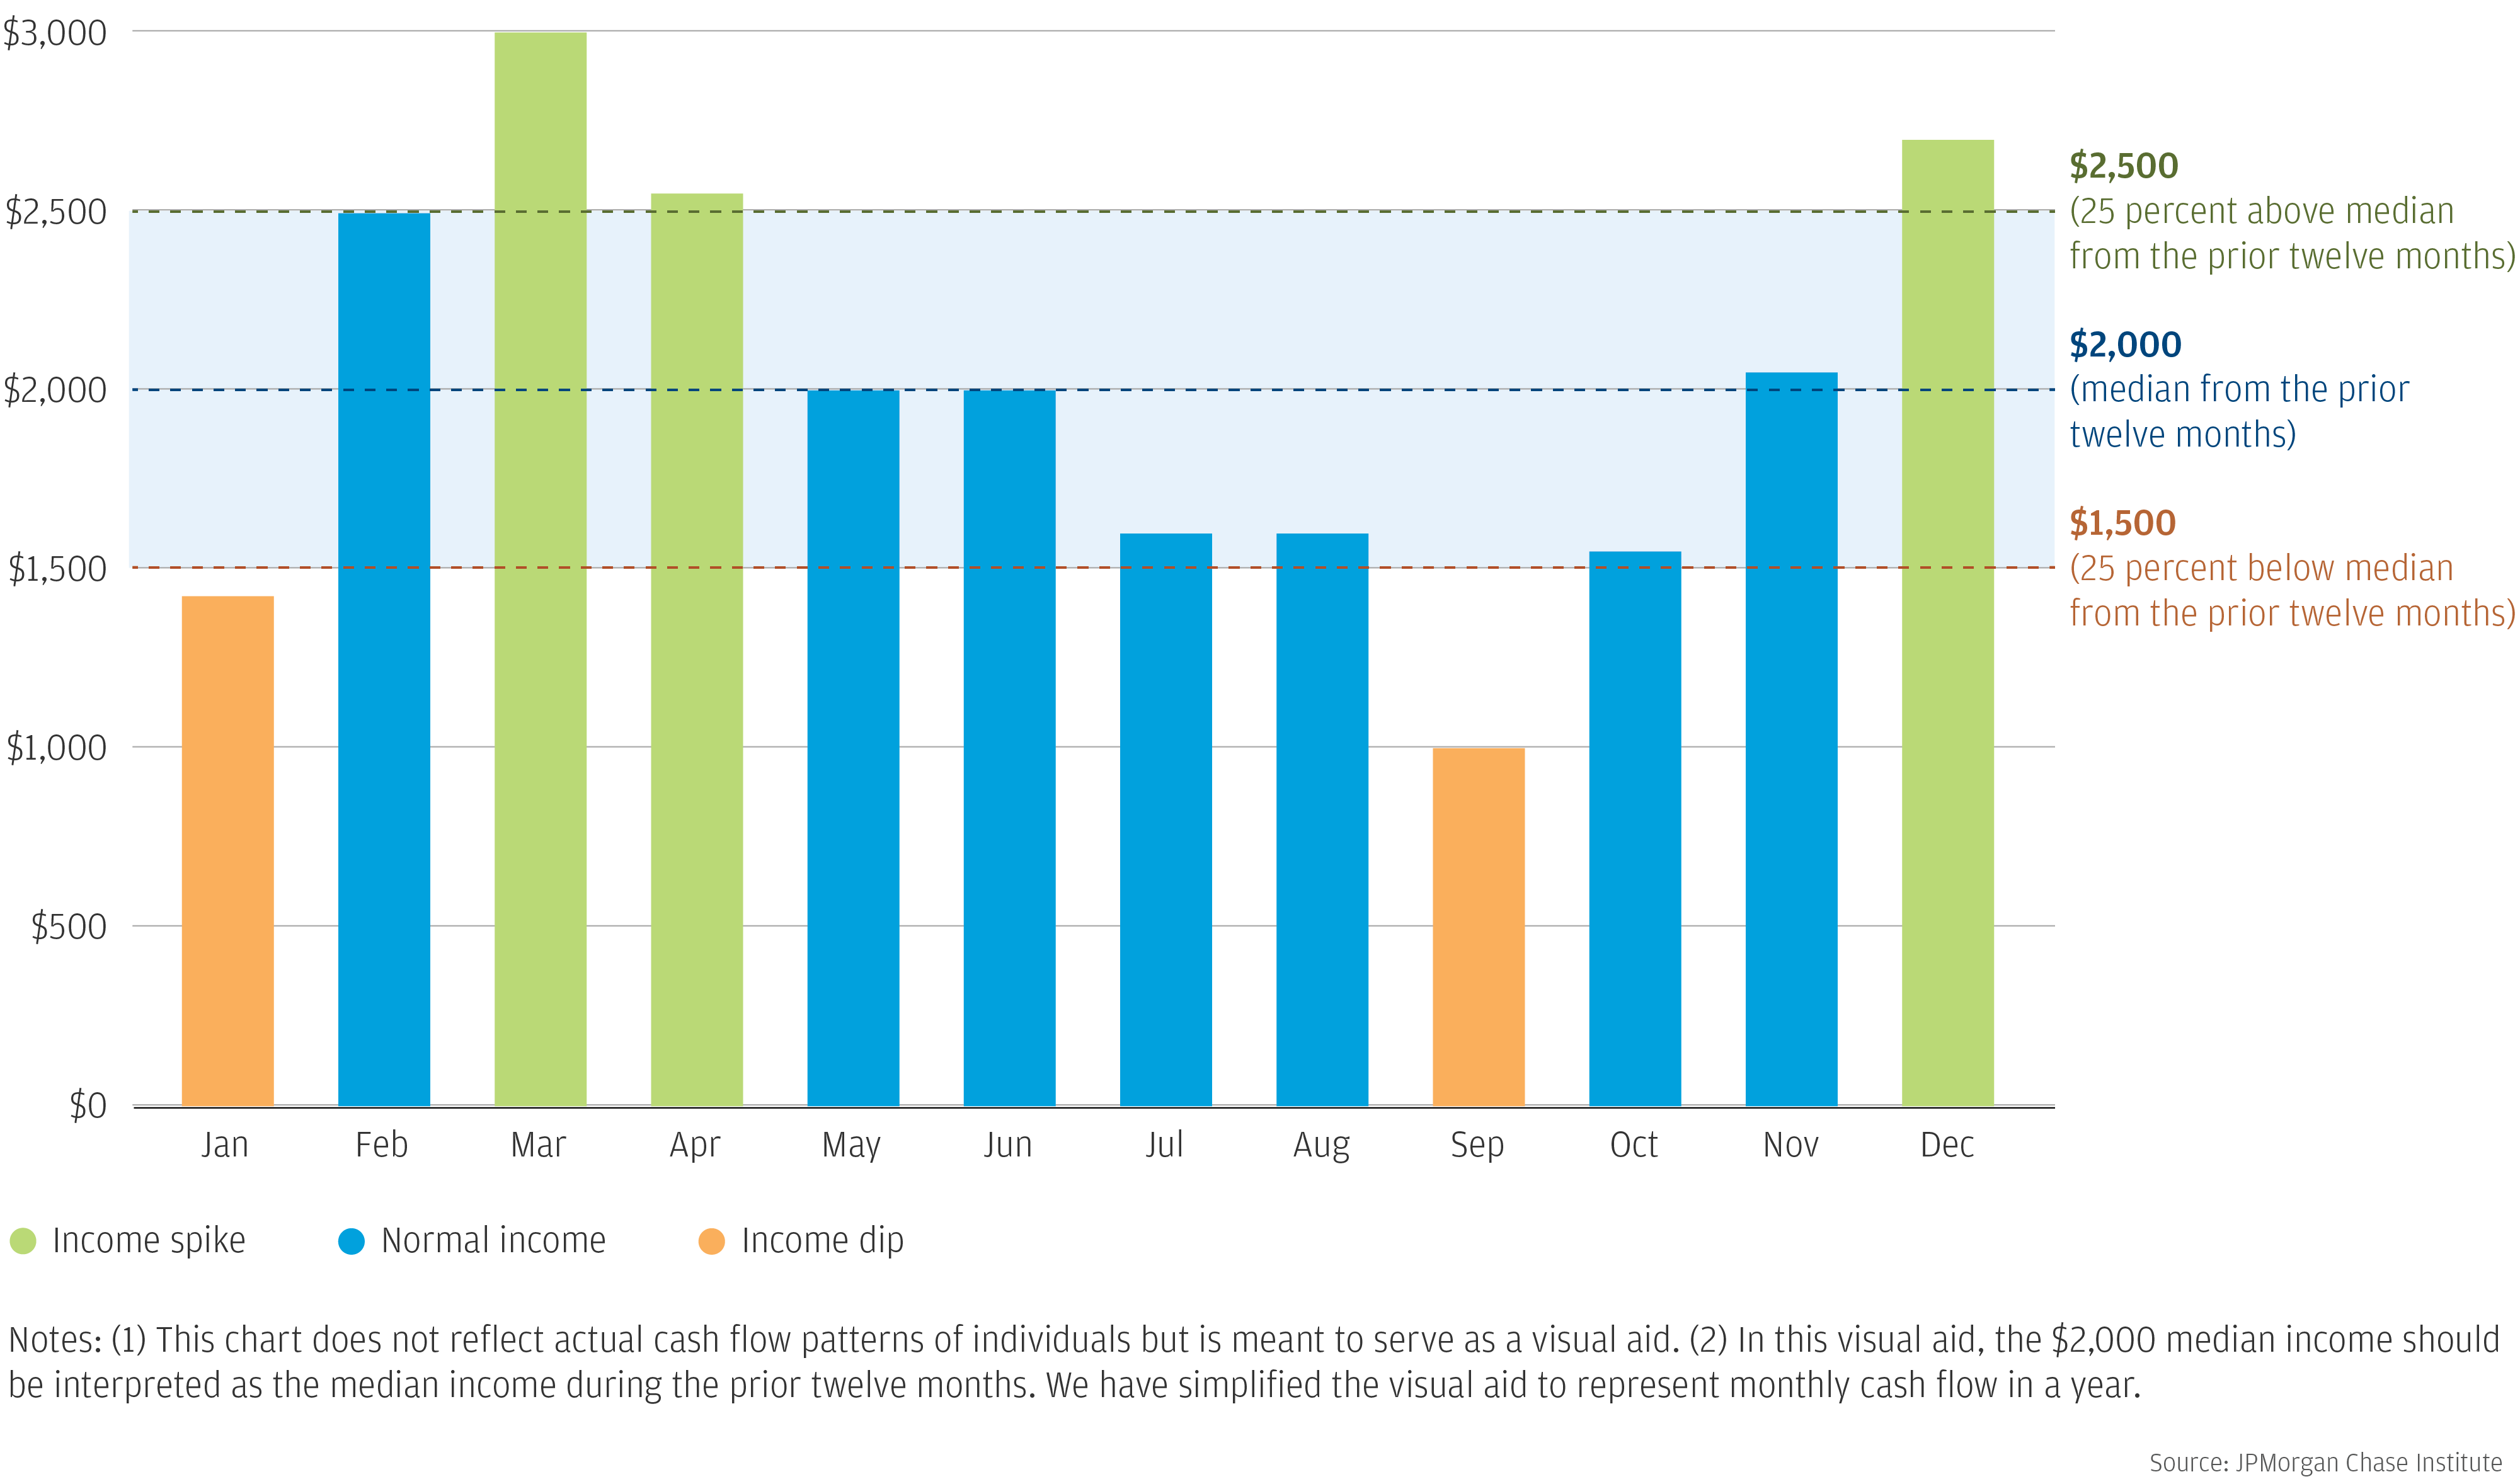
Figure 1: An illustrative example of income spikes, dips, and typical months.

Taxes are one of life’s few certainties. Previous tax seasons often serve as a reliable guide for families in predicting their likely refunds or payments each year, and families adjust their saving and spending accordingly. But for many families, the 2019 tax season created uncertainty due to the effect of changes enacted by the Tax Cuts and Jobs Act. According to the Internal Revenue Service, there was a 15.8% decrease in total tax refunds in 2019, the first tax season under the revised tax law. In 2018, the average refund was $2,135, compared to $1,949 in 2019, a 23.2% decrease1. Most of this change is attributed to the new law, which made significant changes to tax brackets, standard deductions, and credits for families with children. Tax specialists indicate that the lower tax refunds in 2019 were due to families receiving higher paychecks throughout the year, yielding a lower refund or in some cases even a tax payment, according to the General Accounting Office2.
Tax time constitutes a major annual financial event, which shapes families’ patterns of spending and saving throughout the year. The JPMorgan Chase Institute has examined the tax time event in the context of families’ finances, including the impact of tax payments or refunds and the connection between receiving a refund and out-of-pocket healthcare spending. In our report Weathering Volatility 2.0: A Monthly Stress Test to Guide Savings, we found that on average, families experience large income swings in almost five months out of a year, namely February, March, April, and December. The spikes in the beginning of the year are likely due to tax refunds.
Figure 1: An illustrative example of income spikes, dips, and typical months.

In Tax Time: How Families Manage Tax Refunds and Payments, we examined the impact of tax time on families for the years 2015 through 2017, prior to the enactment of the Tax Cuts and Jobs Act changes. During the years studied, families who made tax payments, just 8 percent of our sample, typically had sufficient funds in their checking accounts to cover these payments. For almost all families who made payments, the payment had no lasting impact on their flows or balances. These families did not cut expenditures or increase their labor income to cover the payment. Instead, they transferred cash into their checking accounts during the three weeks leading up to the payment. This is true even for families who didn’t appear to have enough cash to cover their payments just a few weeks before making them.
The vast majority of families in the U.S. receive a tax refund, 78 percent of our sample. For 29 percent of these families, the day the tax refund arrived was the day of the year with the highest positive cash flow, an average refund of $3,602, or equivalent to six weeks’ worth of take home pay. The day the tax refund arrives, families spend roughly $180 more than typical, a 119 percent increase. They also set aside a significant amount to savings. Six months after receiving a refund, the average family’s spending levels had settled to a new steady-state, almost 7 percent higher than the pre-refund steady state. Even still families’ checking account balances were 11 percent higher than baseline six months after the tax refund.
Given the large increase in expenditures when the tax refunds arrives, we studied what people spent their tax refund on. We find that families put off spending and accrue credit card debt while they wait for their tax refund to arrive. On average, about one fifth of the expenditure response within the first week of the tax refund represents families paying down bills – mostly bills from past consumption, including credit card and healthcare bills. Thus, some of the tax refund, which is the repayment of an interest-free loan to the government, is used to pay down interest-bearing credit card debt. Spending on durable goods doubles in the week after receipt of a refund from $25 during a typical week to $50 post-refund. Families also more than double their cash withdrawals, extracting roughly $200 more in cash than usual. Lower income families and those with lower cash balances are especially likely to time durable goods spending around their tax refund, and to carry higher revolving credit card debt until they receive it.
Figure 2: Expenditures on durable goods, credit card payments, and cash withdrawals increase most sharply upon receipt of a tax refund—and families for whom the refund has a larger cash-flow impact increase their spending and saving more sharply upon receipt.

For many families, the tax refund lasts far beyond tax season, fueling spending and saving for more than half the year. This raises questions about whether families have the cash management tools and information they need to integrate their tax refunds into financial planning.
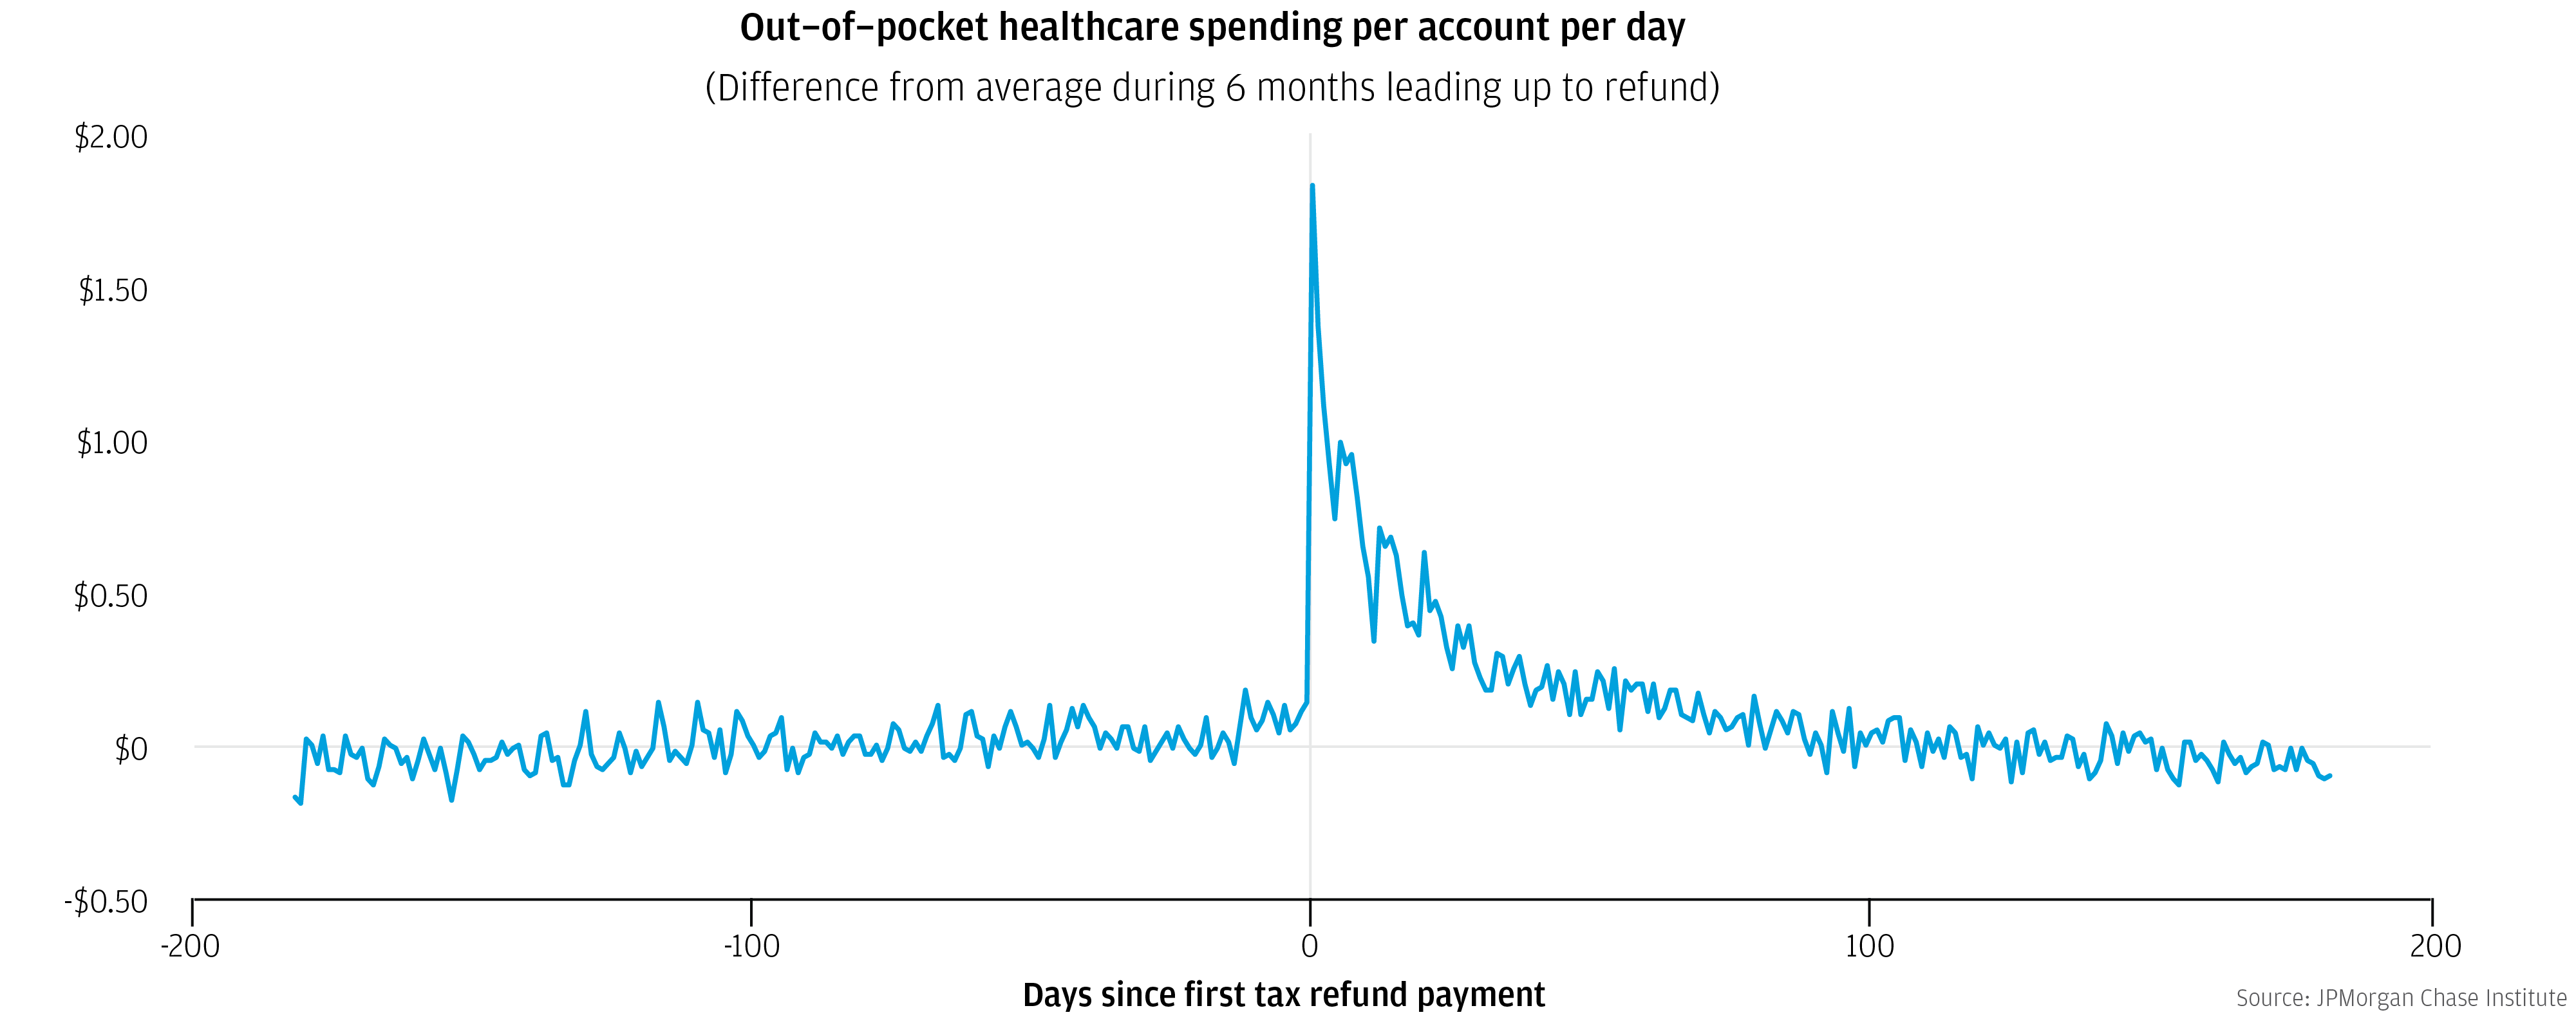
We also find that tax refunds are a significant driver of out-of-pocket spending for healthcare in our report Deferred Care: How Tax Refunds Enable Healthcare Spending. The overall level of healthcare spending is 60 percent higher in the week after receiving a tax refund than in a typical week over the 100 days before. In the week after receiving a tax refund, out-of-pocket healthcare spending on debit cards increased by 83 percent, and electronic payments increased by 56 percent. There was no offsetting change to credit card spending, suggesting that the liquidity provided by the tax refund drove the change in spending behavior.
Figure 3: Out-of-pocket healthcare spending spikes when a tax refund payment is received

We find that cash flow dynamics drive not only when families pay for healthcare but also when they actually receive healthcare. Sixty-two percent of the increase in out of pocket healthcare spending in the week after the tax refund represented in-person payments for healthcare services. It is likely that payments made at the point of service are made at the time that the service is provided. In that case, the additional dollars spent in person would identify deferred care—healthcare services that consumers would have received earlier, if their refund payment had come earlier.
Experts have posited that if consumers had more choice in their healthcare, they would be able to make more cost-effective choices; however, our research underscores the important role of cash flow in healthcare consumption. Cash flow constraints might prevent seeking high-cost care in the short term, even if it would be better for the patient and the healthcare system overall in the long run.
How families manage household income and spending volatility and financial uncertainty is a key research area for the JPMorgan Chase Institute and an increasingly important area of innovation and policy discussion. Now that we’re entering the second tax season with the Tax Cuts and Job Act, did families retain the same withholdings so they can receive higher paychecks and lower refunds, or change the withholdings to maximize the tax return? How did families manage their spending, saving, and healthcare in the new tax environment? We look forward to continued research and analysis in this area, as we seek to apply our granular data lens in order to provide a unique perspective on household income and spending.
“Filing Season Statistics for Week Ending February 8, 2019,” IRS, last modified January 17, 2020, https://www.irs.gov/newsroom/filing-season-statistics-for-week-ending-february-8-2019.
IRS waives penalty for many whose tax withholding and estimated tax payments fell short in 2018,” IRS, last modified January 16, 2019, https://www.irs.gov/newsroom/irs-waives-penalty-for-many-whose-tax-withholding-and-estimated-tax-payments-fell-short-in-2018.