
Figure 1: Credit card spending dropped by 40 percent across age cohorts.

Creating thriving communities together
See how our clients and partners—from small business owners to workforce training leaders—work with JPMorganChase to drive meaningful impact and economic growth where they live and work.
Learn moreLatest news

Veteran’s Unconventional Path to Landing her Dream Job in Tech
U.S. Army Veteran Ashley Wigfall transitioned to a civilian role and charted her path to technologist through mentorship and skills training at the JPMorgan Chase tech hub in Plano, Texas.
Learn more
Findings
In “The Initial Household Spending Response to COVID-19: Evidence from Credit Card Transactions” we provided a first look at changes in household spending during the initial weeks of the Coronavirus pandemic. In this insight we answer two additional questions. First, to what extent did total credit card spending vary by the age and gender of the primary account holder? Second, given that social distancing policies did not apply to businesses deemed “essential,” what accounts for the 20 percent aggregate drop in essential spending as of the second week of April? We focus on spending on essential categories because they have greater welfare implications for families.
First, we find little heterogeneity in the spending drop by age or gender, documenting almost identical spending responses by men and women, old and young. This is consistent with prior evidence that, as of the second week of April, the 40 percent drop in consumer spending appears to be driven to a greater extent by the pandemic and social distancing policies implemented country-wide to prevent its spread, and to a lesser extent by the initial round of income losses, which disproportionately affected younger and female workers.
Second, we find substantial heterogeneity across spending categories within the large class of goods and services deemed essential.1 In fact, large drops in spending on healthcare and transportation contribute significantly to the 20 percent decline in “essential” spending. Thus, even though businesses deemed essential were permitted to stay open, not all such businesses and services were spared in terms of spending drops, and many families may have likely deferred healthcare.
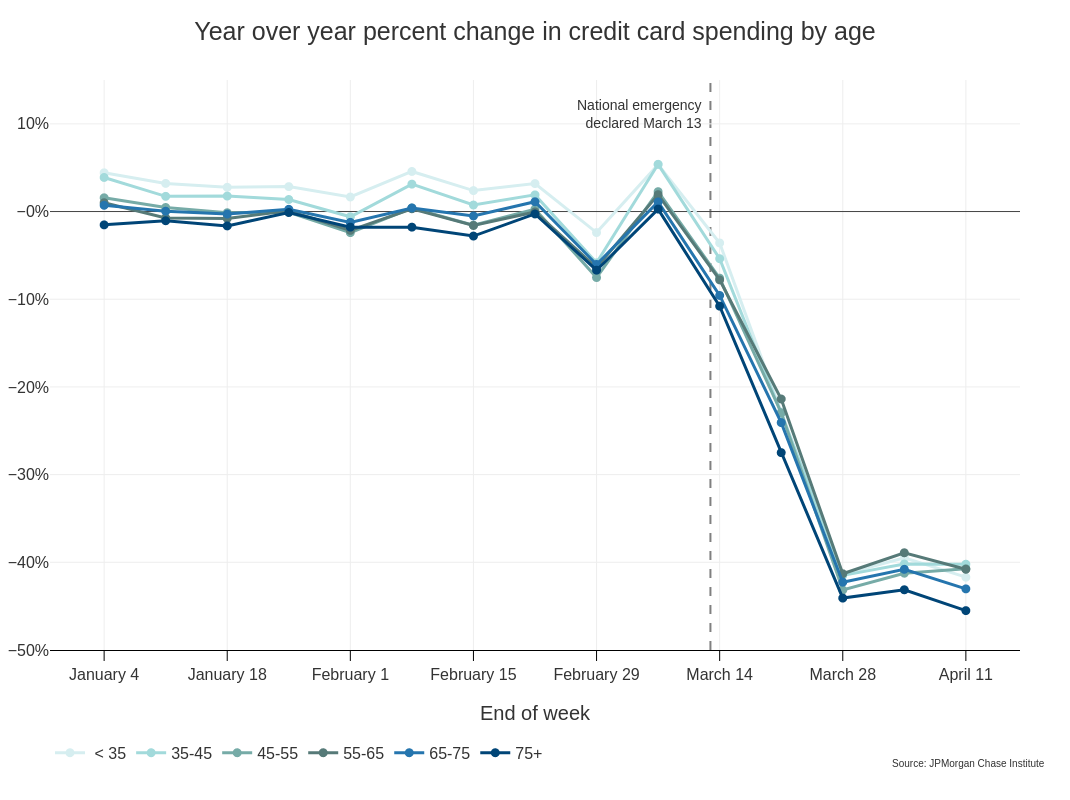
In prior work we found little heterogeneity in the spending drop by income level or industry of employment. Here we split our sample by characteristics of the primary account holder, namely age and gender. There are many reasons to think individuals in different age cohorts may be impacted differentially by the virus. On one hand, older individuals have a higher mortality risk if they contract the illness, which may curb activity and thus spending. On the other hand, the 65+ population has lower labor market participation and thus may be less impacted by income losses. Younger individuals may be less worried about transmission risk but are nonetheless restricted by social distancing policies and more impacted by job losses.
Our data show that the spending response was very similar across the age distribution. Figure 1 plots the spending response for individuals grouped into 10-year age bins. While there were some differences in year-over-year spending by age, they were not significantly larger after the pandemic began. All groups, regardless of age, cut their spending by roughly 40 percent.
Figure 1: Credit card spending dropped by 40 percent across age cohorts.
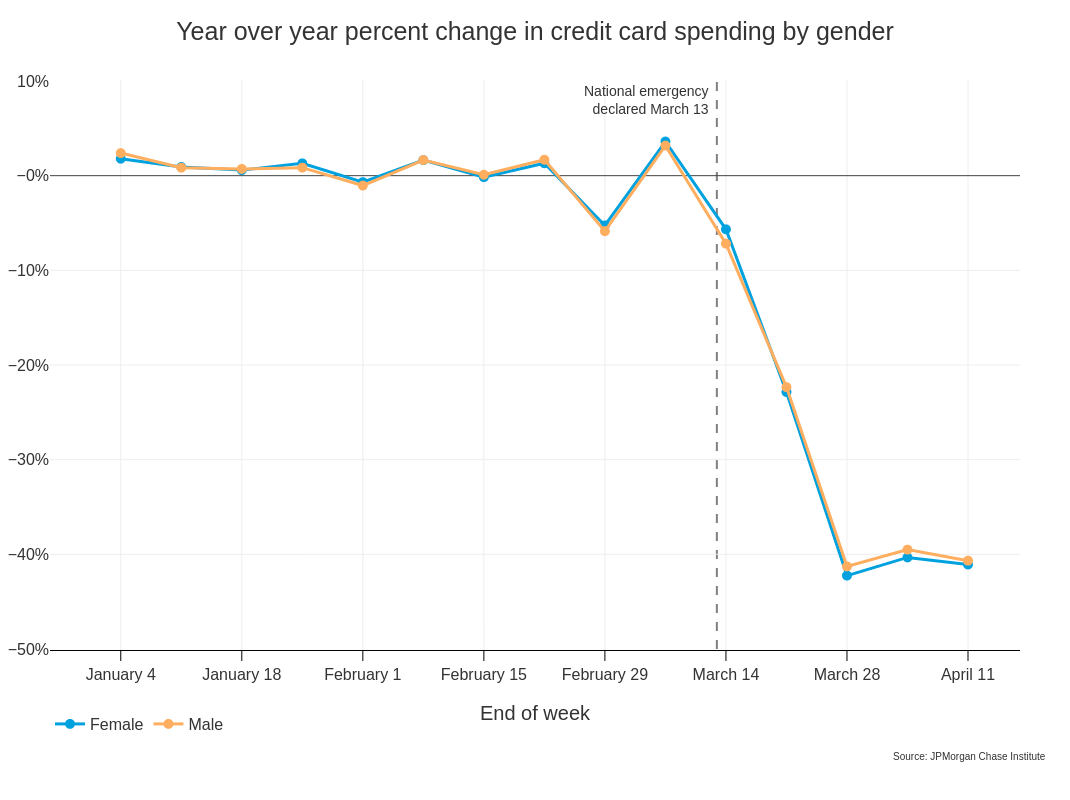
Given evidence that women have experienced slightly more job losses than men, it is plausible that we might see gender differences in the spending response.2 Gender-specific trends in credit card spending are nearly identical, however. Figure 2 shows that year-over-year fluctuations in spending for men and women mirrored each other both before and during the pandemic, falling at the same time and by the same amount.
Figure 2: The drop in credit card spending was similar regardless of the gender of the primary account holder
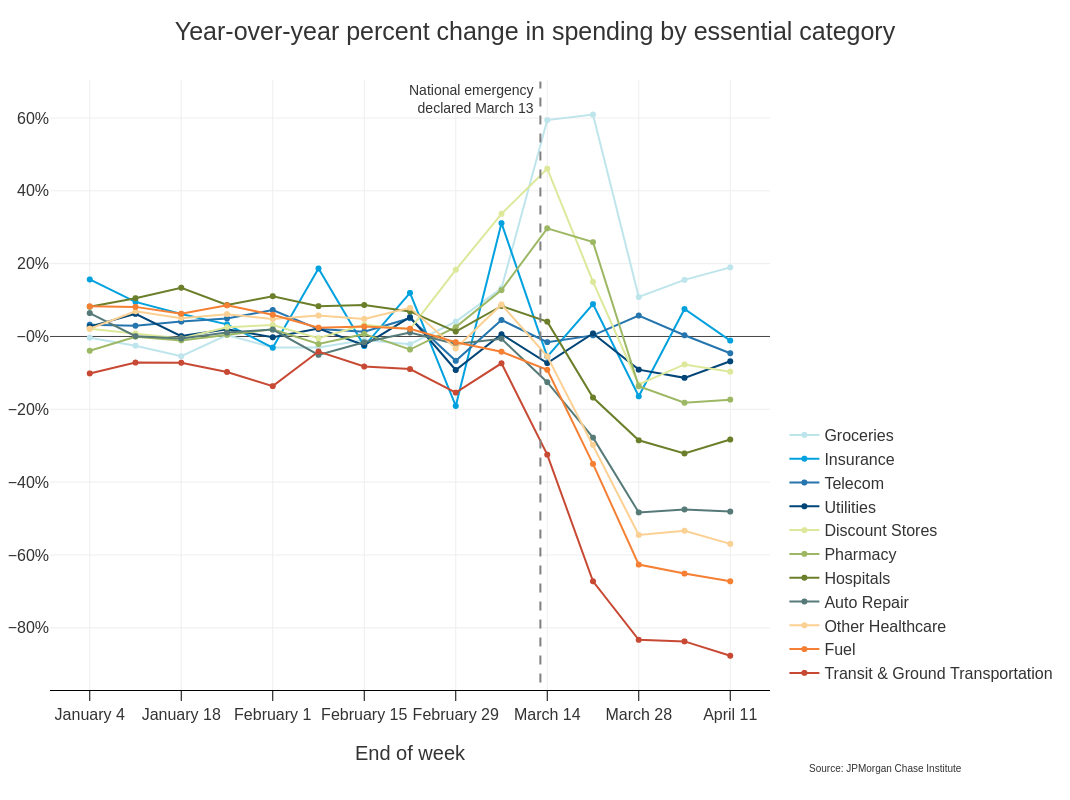
Building on our prior work, which disaggregated the spending drop into non-essential and essential categories, we further explore changes in credit card spending on essential goods and services. As previously reported, in aggregate, essential spending spiked by roughly 20 percent in early March before dropping by 20 percent by the end of March. However, Figure 3 shows a wide range of spending responses among goods and services deemed essential. In the first few weeks of March there was a temporary surge in spending on groceries, discount stores, and pharmacies. Spending at grocery stores, which contributes the largest share of total essential spending, remained more than 15 percent elevated through April 11.
In contrast, spending in several other essential categories dropped considerably. For example, our analysis distinguishes between “hospital” and “other healthcare” spending, which includes doctor and dentist offices as well as opticians and other healthcare goods and services. While spending in both categories declined during the pandemic, spending at hospitals dropped by roughly 30 percent compared to the 55 percent drop in other healthcare. Although a drop in out-of-pocket healthcare spending does not necessarily imply a commensurate drop in healthcare utilization, the sheer magnitude of decline in healthcare spending suggests that many families may have deferred medical care during the pandemic either by choice or because healthcare providers are limiting non-urgent or elective care.3
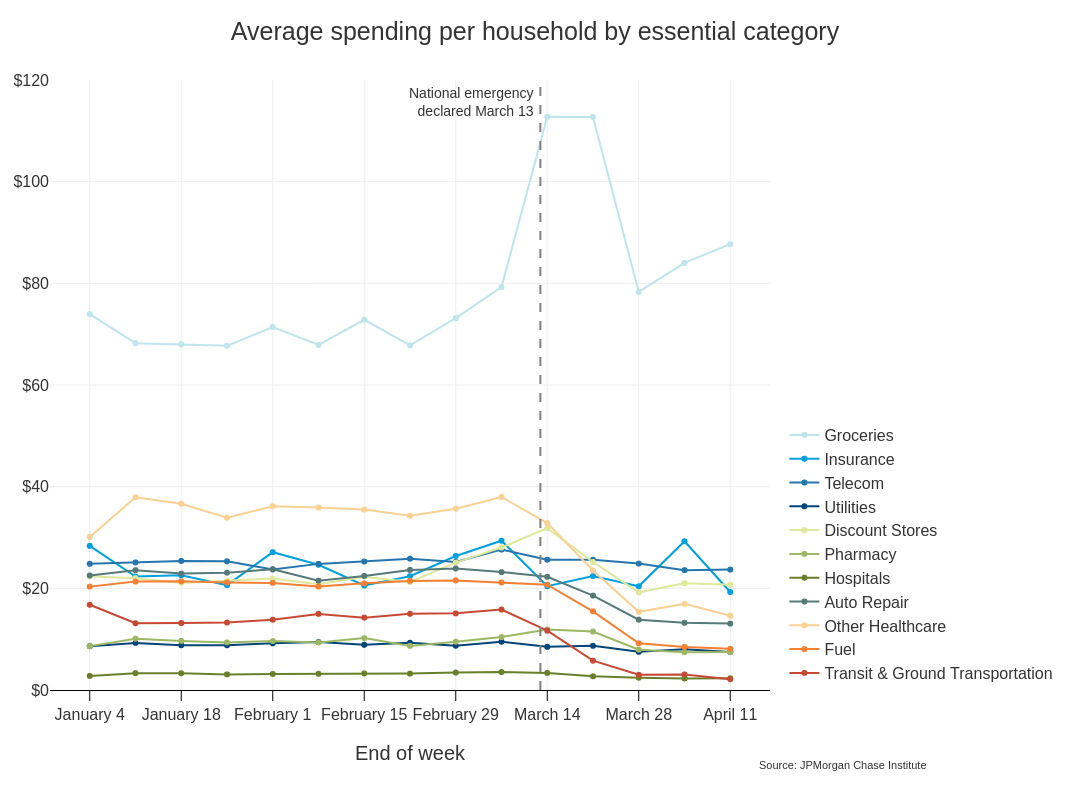
In fact, the drop in healthcare spending accounts for the largest share of the drop in essential spending on credit cards. Notably, before the pandemic, other healthcare was the second largest category (in dollar terms) in essential spending, but by April, households were spending less on other healthcare than telecom.4 As a result, other healthcare spending contributed the most to the aggregate drop in essential spending, accounting for 36 percent of the drop in essential spending. The drop in hospital spending accounted for an additional 2 percent of the decline in essential spending. Potentially relatedly, spending at pharmacies was also down by 18 percent by the second week of April, accounting for an additional 3 percent of the drop in essential spending, though pharmacy purchases can include grocery and household items.
The next largest contributor to the drop in essential spending were categories likely impacted by the fact that a large majority of the workforce was no longer commuting to work. These include transit and ground transportation spending, which fell by more than 80 percent. Additionally, fuel spending dropped by more than 60 percent likely due both to mobility restrictions and the 26 percent drop in fuel prices between January and April 2020. The drop in transit and ground transportation spending and fuel purchases accounted for 29 percent and 30 percent of the aggregate drop in essential spending, respectively.
Finally, auto repair dropped by roughly 50 percent, accounting for an additional 23 percent of the drop in essential spending, while spending on utilities, telecom, and insurance stayed roughly constant.
Figure 3: The surge in grocery spending was offset by large declines in spending on healthcare, transit and ground transportation, and fuel.
In summary, we provide evidence suggesting that, as of the second week of April, the 40 percent drop in consumer spending appears to be driven to a greater extent by the pandemic and social distancing policies implemented across the country to prevent its spread and to a lesser extent by the initial round of income losses. As we have previously shown, the 40 percent drop in spending was observed across the income distribution and regardless of industry of employment. Here we show that the spending drop was similar across the age distribution and among men and women.
Additionally, we show that even though businesses deemed essential were permitted to stay open, not all such businesses and services were spared in terms of spending drops. Major drops in spending have occurred in healthcare, likely reflecting deferred care among many families. And essential services, such as transit, have seen large declines owing to stay at home orders.
These data capture only the initial, short-run reaction of credit card spending to the pandemic. The balance of factors contributing to spending behavior could change dramatically as the pandemic unfolds. Additionally, levels and changes in spending could vary across credit cards versus other payment channels. In the future, we will broaden the array of payment channels we examine as we continue to track the path of income and spending, as well as the net effect on liquid asset balances over time.
Examples of prior work that has shown changes in spending by category include Opportunity Insights and the NYTimes.
Bureau of Labor Statistics reported an unemployment rate in April 2020 of 13.0 percent for adult men, and 15.5 percent for adult women. Administrative payroll data show declines in employment between mid-February 2020 and early-April 2020 were slightly larger for women (21.5 percent) compared to men (17.8 percent).
Other data have also shown a drop in consumer healthcare spending of more than 50 percent. That said, as stated, the large drop in out-of-pocket healthcare spending may not directly translate into a commensurate drop in healthcare received. The CDC issued guidance to healthcare providers to prioritize urgent visits, delay elective care, and leverage telemedicine to the extent possible to mitigate the spread of COVID-19 in healthcare settings. Many insurance providers have begun waiving out-of-pocket costs for all telemedicine visits as well as COVID-19 testing and treatment. Additionally, it is worth noting that by the end of the analysis window (starting on April 10), healthcare providers may have started receiving payments from the CARES Act Provider Relief Fund, which was established to provide funding to healthcare providers on the front lines of the coronavirus response to support healthcare-related expenses or lost revenue attributable to COVID-19 and ensure uninsured Americans can get testing and treatment for COVID-19.
Relative levels and changes in spending across categories can differ across credit cards versus other payment channels. Notably healthcare spending is higher on credit cards than debit cards, which could reflect both sample selection as well as payment channel preferences.
First and foremost, we thank Tanya Sonthalia and Therese Bonomo for their outstanding analytical contributions to the report. We are additionally grateful to Samantha Anderson, Maxwell Liebeskind, Robert McDowall, Shantanu Banerjee, Melissa Obrien, Erica Deadman, Sruthi Rao, Anna Garnitz, Chris Knouss, and Preeti Vaidya for their support and contributions along the way.
We are also thankful for the invaluable constructive feedback we received from external experts, including Jesse Edgerton, Michael Feroli, Daniel Silver, Joseph Lupton, Joseph Vavra and Arlene Wong. We are deeply grateful for their generosity of time and insight.
This effort would not have been possible without the diligent and ongoing support of our partners from the JPMorgan Chase Consumer and Community Bank and Corporate Technology teams of data experts, including, but not limited to Brian Maddox, Kyung Cho-Miller, Michael Aguilar, Albert Raymond, Breann Zickafoose, Scott Dodds, Jay Mathuria, Roma Patel, Andrew Goldberg, Derek Jean-Baptiste, Anthony Ruiz, Suresh Devarar, Ravi Tummalapenta, Jeff Hamroff, Senthilkumar Gurusamy, and Melissa Goldman. The project, which encompasses far more than the report itself, also received indispensable support from our Internal partners in the JPMorgan Chase Institute team, including Elizabeth Ellis, Alyssa Flaschner, Carolyn Gorman, Sarah Kuehl, Carla Ricks, Gena Stern, Parita Shah, Haley Dorgan, and Tremayne Smith.
Finally, we would like to acknowledge Jamie Dimon, CEO of JPMorgan Chase & Co., for his vision and leadership in establishing the Institute and enabling the ongoing research agenda. Along with support from across the firm—notably from Peter Scher, Max Neukirchen, Joyce Chang, Marianne Lake, Jennifer Piepszak, Lori Beer, Derek Waldron, and Judy Miller—the Institute has had the resources and support to pioneer a new approach to contribute to global economic analysis and insight.
Authors

Diana Farrell
Founding and Former President & CEO

Fiona Greig
Former Co-President

Natalie Cox
Assistant Professor of Economics, Princeton University

Peter Ganong
Assistant Professor at the University of Chicago Harris School of Public Policy

Pascal Noel
Neubauer Family Assistant Professor of Finance at the University of Chicago Booth School of Business