Research

Infographic: Weathering Volatility

Infographic: How volatile are Amercians' finances?

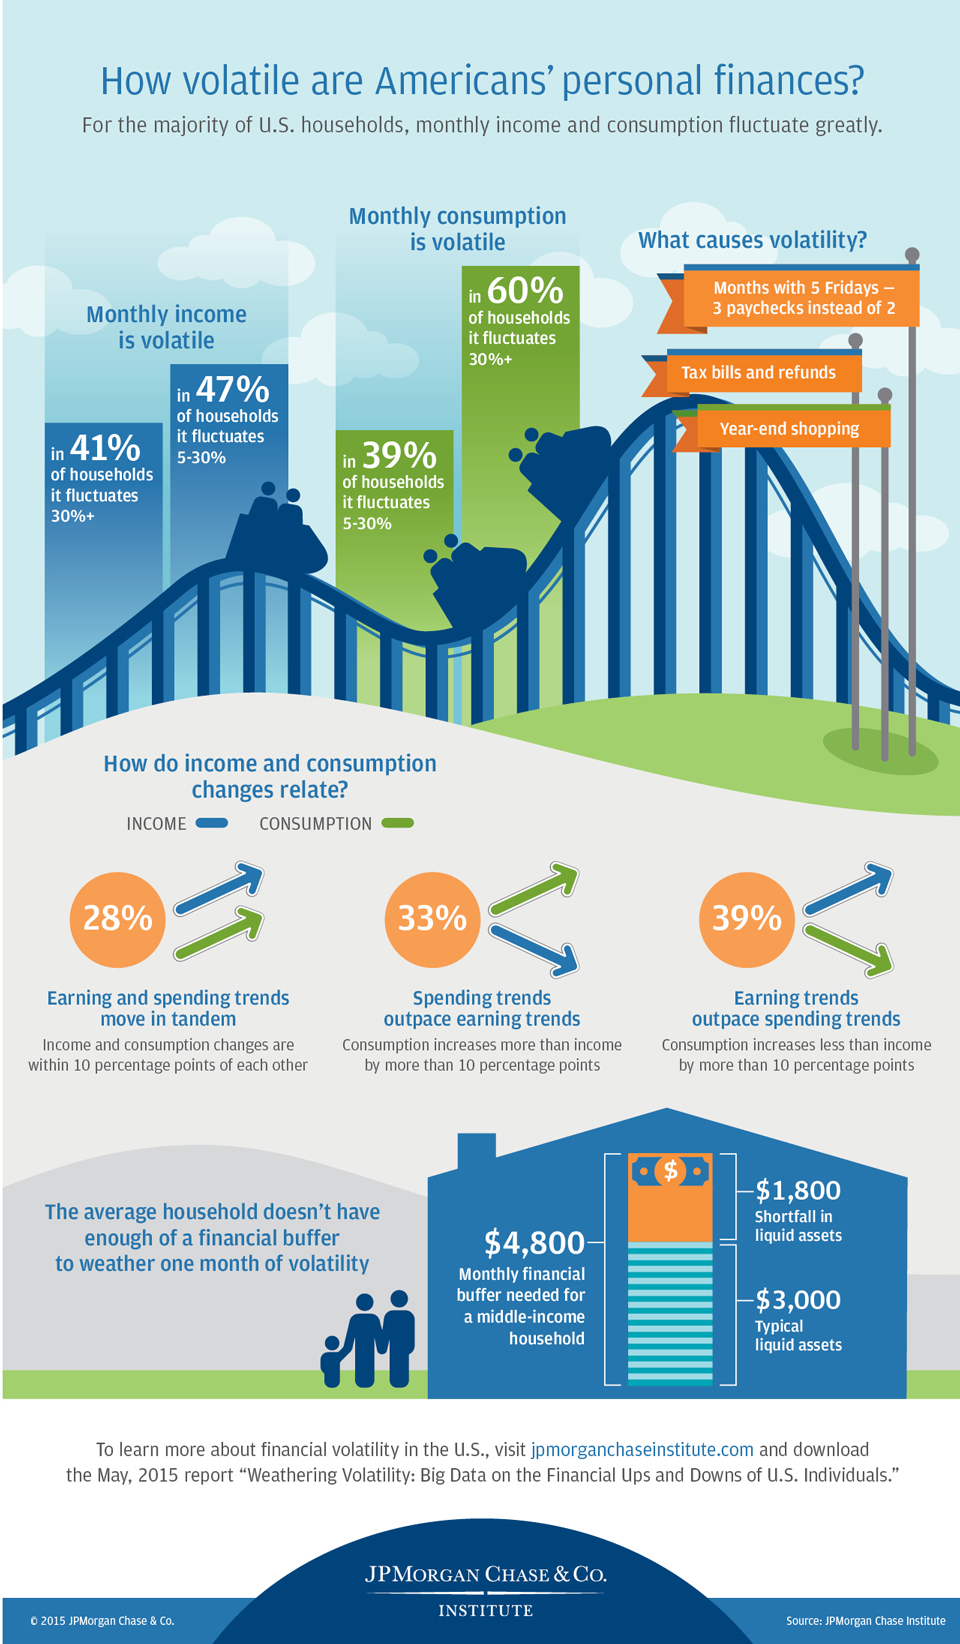
How volatile are Americans' personal finances?


For the majority of U.S. households, monthly income and consumption fluctuate greatly.

Monthly income is volatile

  • in 41% of households it fluctuates 30%+
  • in 47% of households it fluctuates 5-30%

Monthly consumption is volatile

  • in 39% of households it fluctuates 5-30%
  • in 60% of households it fluctuates 30%+

What causes volatility?

  • Months with 5 Fridays — 3 paychecks instead of 2
  • Tax bills and refunds
  • Year-end shopping

How do income and consumption changes relate?

Earning and spending trends move in tandem

  • Income and consumption changes are within 10 percentage points of each other
  • Amount of people: 28%

Spending trends outpace earning trends

  • Consumption increases more than income by more than 10 percentage points
  • Amount of people: 33%

Earning trends outpace spending trends

  • Consumption increases less than income by more than 10 percentage points
  • Amount of people: 39%

The average household doesn’t have enough of a financial buffer to weather one month of volatility.

$4,800 is the monthly financial buffer needed for a middle-income household.

  • Typical liquid assets are about $3,000.
  • The shortfall in liquid assets equals about $1,800.

© 2018 JPMorgan Chase & Co.