

Figure 1 : Relative to 2021, the amount of CTC available at tax time in 2022 decreased for all families, by a median of $500 and as much as $1,500.
Latest news

An Ohio-based company is protecting first responders around the world
With support from JPMorganChase, Fire-Dex is providing protective equipment to firefighters in 100 countries and all 50 states.
Learn moreLatest news

Veteran’s Unconventional Path to Landing her Dream Job in Tech
U.S. Army Veteran Ashley Wigfall transitioned to a civilian role and charted her path to technologist through mentorship and skills training at the JPMorgan Chase tech hub in Plano, Texas.
Learn more
Research
March 27, 2024
Findings
Introduction
On March 11, 2021, President Biden signed the American Rescue Plan Act of 2021 (ARPA) into law. The stimulus bill aimed to deliver direct relief to families and workers continuing to struggle financially during the ongoing COVID-19 pandemic.1 A notable component of ARPA was the expansion of the existing Child Tax Credit (CTC) program. It was unprecedented in its scale—characterized by its designers as “the largest child tax credit ever and historic relief to the most working families ever.”
It was also novel in its structure: the overwhelming majority of families with children received half of their newly expanded CTC through monthly payments over the second half of 2021, instead of receiving the entire credit through their tax refund the following year.2 This change gave families more timely access to their CTC funds, which they used to help pay for bills and other basic living expenses like food (Pilkauskas and Cooney 2021; Karpman et al. 2021; Pilkauskas et al. 2022), spending a large portion of their advance CTC payments right away (Wheat et al. 2022).3
While the advance CTC payments provided liquidity to many families and the expansion of the credit contributed to lower child poverty, the monthly disbursal of payments during the second half of 2021 came with a tradeoff.4 In 2022, households would receive tax refunds substantially lower than their expectations because some of their tax-time CTC money was included in the advance payments. All else equal, a couple with two school-age children would see their refund decrease by $1,000 relative to the previous year.5 Tax refunds are substantial cash flow events that lead to significant increases in spending for many families (Baugh et al. 2018; Farrell et al. 2019). How did tax refunds received—or tax payments owed—change, and how did the spending response to the remaining tax refund change? Did this change disrupt families’ regular tax-time financial activities?
These questions are important for the design of future government support programs, and this report seeks to answer them. Using transaction-level data, we estimate the impact of the 2021 advance CTC payments on households’ federal tax refunds—or taxes owed—in 2022. We then estimate how households changed their spending behavior in response. We explore a range of spending categories, including spending on durable goods, services, and debt payments. We also analyze whether changes were more pronounced for households with lower liquidity. Overall, we find remarkably consistent year-over-year tax-time behaviors, given the scale of the advance CTC payments and subsequent decrease in federal tax refund amounts for CTC recipients. Our precise measurement of the spending response to this government benefit, and the behavioral impacts of changes in benefit amount and timing, can improve the efficiency of future programs by enabling policymakers to target the right households at the right cadence.
We find that:
These findings have several important implications. While this and prior work consistently finds that households with low liquidity spend more of their tax refunds right away, the smaller tax-time CTC payments do not appear to have significantly affected how much households spent after getting their tax refund, regardless of liquidity. This lack of response may suggest that some part of the tax-time spending response is driven by routine (i.e., payment receipt creates and inflows-induced spending effect) and is not driven only by demand deferred due to liquidity constraints. This in turn suggests that policymakers have some leeway to steer household finances, either further increasing monthly liquidity by shifting a larger share of annual payments to monthly payments, or further increasing saving by doing the opposite.
The advance CTC payments were lauded for boosting short-term liquidity of recipients – monthly take-home income rose by 10 percent for the lowest-earning recipients and by 4 percent for the highest-earning recipients (Wheat et al. 2022). However, because the amount of CTC advanced to households was larger than the amount of the CTC increase, the amount of the credit available at tax time in 2022 was lower than the amount at tax time in 2021.6
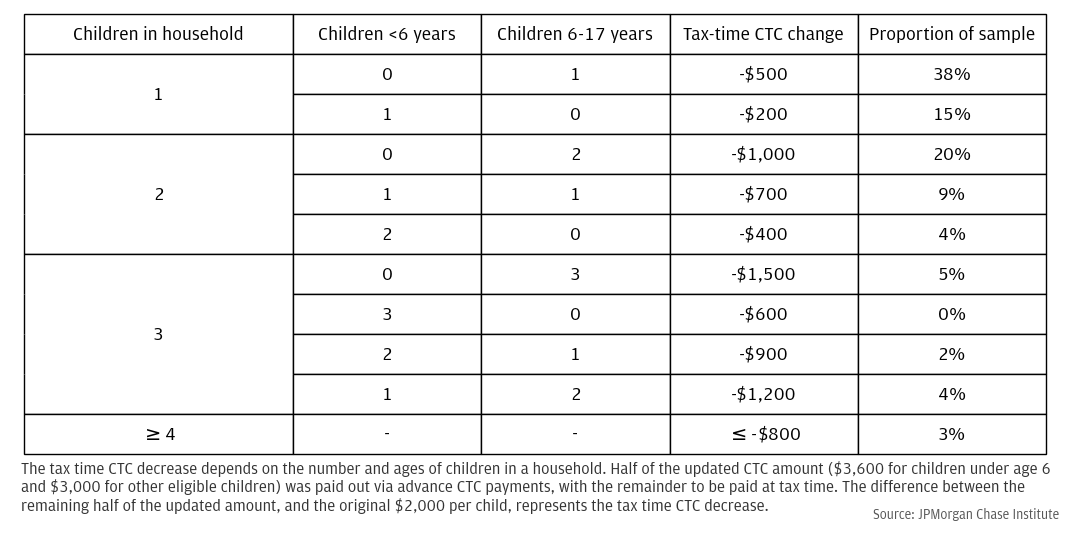
The amount of the decrease in the CTC available at tax time can be calculated based on the number and ages of children in the household. As shown in Figure 1, the amount of the credit at tax time in 2022 decreased for all families relative to tax time in 2021, by a median of $500 and as much as $1,500. This raises the question of whether the advanced disbursal of half of the credit might have pushed households from receiving federal tax refunds to owing federal tax payments at tax time.
Figure 1 : Relative to 2021, the amount of CTC available at tax time in 2022 decreased for all families, by a median of $500 and as much as $1,500.
We compared each household’s tax time CTC decrease with the amount of their 2021 federal tax refund to understand how many households may have been at risk of owing a federal tax payment at 2022 tax time due to the advance payments in 2021. If the amount of decrease in 2022 was similar to the total refund amount in 2021 (within $500), we classified the household as at risk of switching from receiving a tax refund in 2021 to owing a tax payment in 2022.7 Only 4.6 percent of families fell into this “at risk” category. While the tax time CTC decreases were often large, they were not large enough to push many families into owing tax payments, because the amount of typical tax refunds was large enough to buffer against that. For CTC recipient households that received federal tax refunds in 2021, the median refund was around $4,900 (see the Measures section of the Appendix)—more than enough to cushion the tax time decrease in CTC amount and still enable a refund in 2022.
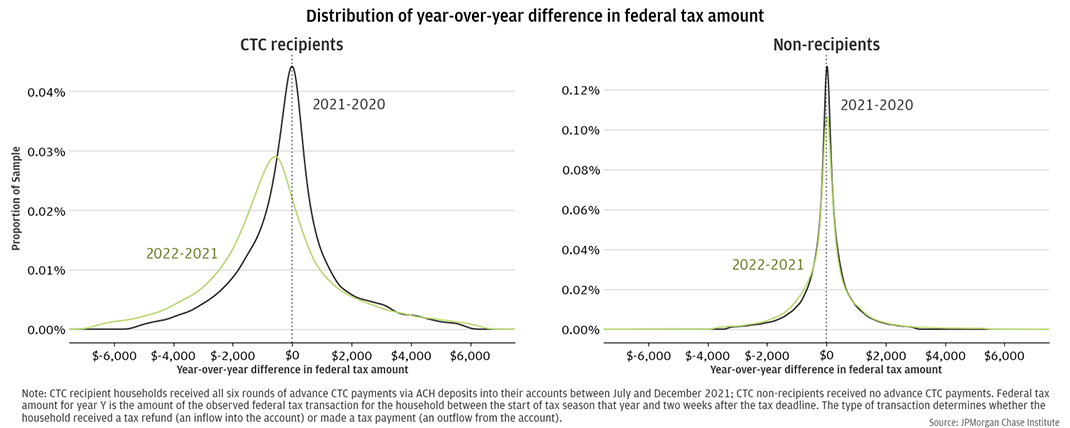
While households that typically received federal tax refunds were unlikely to be pushed into owing a payment at tax time, the 2022 tax-time decrease in the CTC still likely resulted in a smaller tax refund amount (or a larger payment owed for households making federal tax payments). Looking at federal tax refunds and payments following the advance CTC payments, CTC recipients’ tax amounts decreased in 2022 relative to 2021 (either receiving a smaller refund or making a larger payment), with a median reduction of $635. In contrast, CTC recipients’ federal tax amounts were consistent between 2020 and 2021, the two tax seasons prior to the advance CTC payments, with an average year-over-year difference of approximately zero. Likewise, the average year-over-year differences in non-recipients’ federal tax amounts were roughly zero in both 2021-2020 and 2022-2021. Taken together, these results indicate that the shift in 2022 tax amounts for CTC recipients was primarily driven by the advance Child Tax Credit payments in the second half of 2021.
Figure 2 : CTC recipients’ 2022 federal tax payments decreased relative to 2021 (either receiving a smaller refund or making a larger payment), with a median reduction of $635, whereas tax payments were consistent before the advance CTC payments (2021-2020).
While the reduction in federal tax amount for CTC recipient households was often high in dollar terms, those households typically received large federal tax refunds, as noted above. On a proportional basis, the changes in 2022 represented less than a 15 percent reduction in tax refund for the median CTC recipient household. The remainder of this report explores whether reductions of this size impacted households’ ability to use federal tax refunds for desired spending.
To measure how households adjusted their spending in response to the lower tax refunds they received in 2022, we make two levels of comparisons. We compare spending behavior across tax time in 2021 and 2022—before and after disbursal of the advance CTC payments. Because other macroeconomic factors unrelated to advance CTC payments might affect how households spend their tax refunds, we separately assess how spending behaviors changed across CTC recipient households and non-recipient households. CTC non-recipients did not experience a systematic change in their refund amounts, thus any significant changes in their spending behavior between 2022 and 2021 serves as a measure of other factors that influenced spending out of tax refunds.
To isolate the effect of the federal tax refunds and payments for a given year, we use an event study regression to control for time-invariant differences in household-level spending levels, as well as trends in spending levels over time that are common to both groups (CTC recipients and non-recipients). We also control for the timing and amount of the Economic Impact Payments delivered in 2021, as well as the payment and refund of state taxes in both years (see the Model section of the Appendix for details). After removing these trends, our approach assumes that the spending behavior of non-recipients is similar to what CTC recipients would have done had they not received the CTC payments.
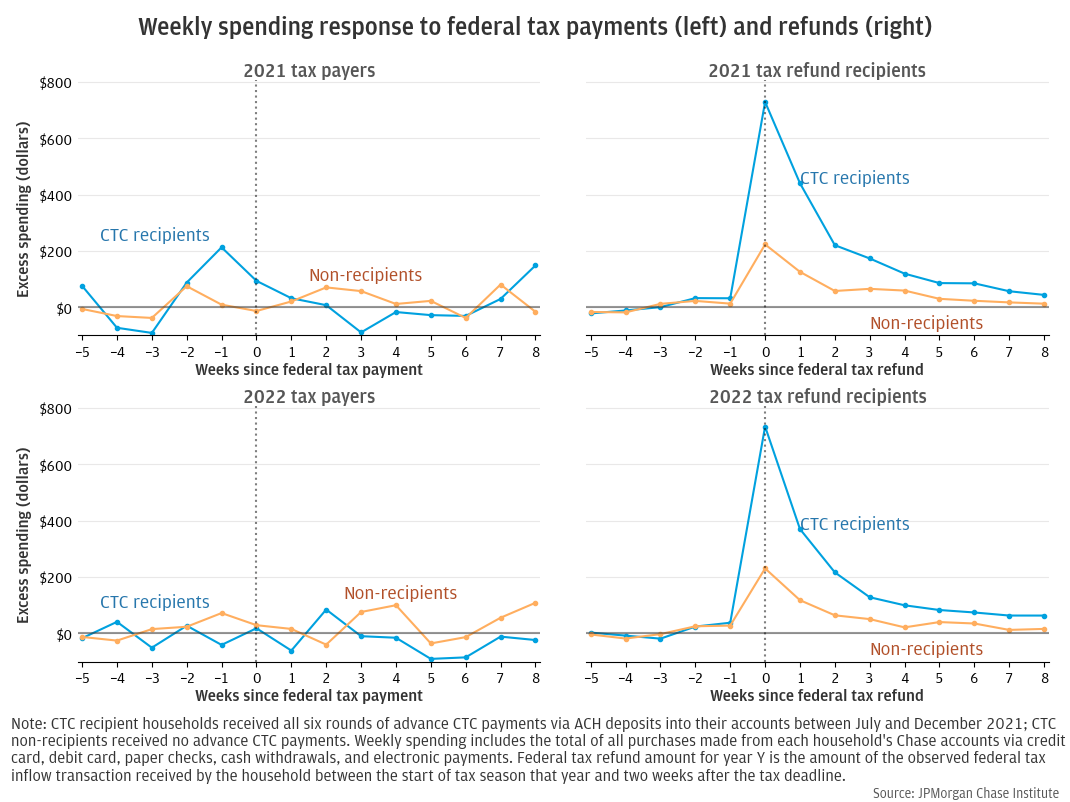
Figure 3 shows families’ weekly spending response to federal taxes in dollars. The top panel of the figure shows the response in 2021—a year unaffected by advance CTC payments. Within this panel, the left figure shows the spending response for households that received tax refunds, while the right figure shows the response for those that made tax payments. The bottom panel of the figure shows the same for households that received refunds and made payments in 2022—the year potentially affected by the 2021 advance CTC payments. The spending shown in these charts can be thought of as “excess” spending in the weeks surrounding a tax refund or payment, relative to a reference period of six or more weeks prior to the tax refund or payment (see Appendix for details). Our measure of spending is the sum of all payments made from each household’s accounts via debit card, paper checks, cash withdrawals, electronic payments (excluding debt payments), and Chase credit cards.8
With this framework, we are interested in the differences across both years and groups.9 Our goal is to understand whether the advance payment of half of the CTC impacted recipient households’ finances and behaviors at tax time the following year, when the reduced tax credit resulted in reduced tax refunds (or increased tax payments). We note that, if other changes in the tax code resulted in tax amount differences between the two years, then we could misattribute the behavioral impacts of those changes to be due to the CTC changes. So, assessing differences across years in CTC recipient response to federal taxes is not sufficient. Including a comparison group of CTC non-recipients provides a baseline to help account for other changes across years, aside from the changes in the CTC. We compared the consumption response to federal taxes for CTC recipients relative to non-recipients in 2021, and assessed whether that difference changed in 2022, following the advance CTC payments.
First, we focus on households that made a federal tax payment. These households did not change their spending around the week of the tax payment. We observed this behavior across years, for both CTC recipients and non-recipients. This is consistent with external research (Baugh et al. 2018). Due to the lack of consumption response to taxes for households making a federal tax payment, the remainder of this report will focus on families that received federal tax refunds.
We observed that households receiving federal tax refunds increased their spending during the week of the tax refund and in subsequent weeks. In the week of a federal tax refund, CTC recipients exhibited a much higher spending response than non-recipients, both before and after the advance CTC payments: in 2021, recipients spent roughly $700 the week of the refund compared to $210 for non-recipients; and $700 compared to $200, respectively, in 2022. However, CTC recipients typically received larger refunds than non-recipients, which would enable higher spending upon receiving the refund: 2021 median refunds were around $4,900 for CTC recipients compared to $1,100 for non-recipients (see below for discussion on marginal propensity to consume).
Finally, we note that the spending response to federal tax refunds was consistent across 2021 and 2022, both prior to and following the disbursal of advance CTC payments, for both CTC recipients and non-recipients. In other words, we do not observe a change in dollar spending response to tax refunds following the advanced disbursal of half of the child tax credit.
Figure 3 : The dollar spending response to receiving a federal tax refund was consistent before (2021) and after (2022) the disbursal of advance CTC payments, for both CTC recipients and non-recipients. Spending did not change, for either group or year, in response to making a tax payment.
Given the large disparity in tax refund amounts between CTC recipients and non-recipients, we could more directly compare the two groups by assessing the share of federal tax refund dollars spent in subsequent weeks, or in other words, the households’ marginal propensity to consume (MPC) out of each refund dollar. This can be thought of as “excess” spending in the weeks surrounding a tax refund or payment, measured as a fraction of the household’s federal tax refund: if a household received a $2,000 refund and then spent $1,000 more than it would have otherwise, its excess spending in Figure 4 would be 0.5.
In the week of receiving a tax refund in 2021, CTC recipient families spent 14.5 percent of their federal tax refund, compared to 11.6 percent spent by non-recipient families. In 2022, after the disbursal of advance CTC payments, CTC recipients received lower federal tax refund amounts and spent 15.6 percent of the refund the week it was received, while the average refund for non-recipients increased slightly and 9.7 percent was spent in the first week. In other words, CTC recipients spent 6 percentage points more of their refund relative to non-recipients in 2022, after the advance CTC payments, compared to a 3 percentage point difference in 2021. However, this slight increase in proportional spending response across years is not statistically significant. In other words, consistent with the above results, we fail to observe a change in spending response to tax refunds following the advanced disbursal of half of the child tax credit.
Beyond the week of receiving a federal tax refund, we observe elevated household spending for several subsequent weeks as well. Overall, CTC recipient households spent roughly 31 percent of their tax refund by the end of the fourth week after the tax refund in 2022, compared to roughly 21 percent spent by non-recipients; in 2021, those numbers were 32 percent for recipients and 24 percent for non-recipients (Figures 5 and 6). After eight weeks, recipients spent 38 percent in 2022, compared to 25 percent for non-recipients; in 2021, those numbers were 39 percent and 28 percent, respectively. Overall, as with spending response in the week of the tax refund, cumulative spending response was comparable in 2022 and 2021 for both groups. In other words, cumulative spending response in the months following a tax refund was also not impacted by the advanced disbursal of half of the child tax credit.
Figure 4 : In 2022, following the advance CTC payments, CTC recipients spent 6 percentage points more of their refund relative to non-recipients, compared to a 3 percentage-point difference in 2021, but this slight increase in proportional spending response is not statistically significant.

As with spending, we also observe that households—both CTC recipients and non-recipients—responded to federal tax refunds by transferring more cash to other accounts than they would in a typical week.10 The accounts receiving these transfers could be owned by the household—such as non-Chase accounts—or accounts owned by people outside of the household, such as family members. Figures 5 and 6 show the fraction of federal tax refund spent by consumption category, including transfers, for each year. The week of receiving a federal tax refund, CTC recipients transferred 7 percent of the refund to other accounts and non-recipients transferred 8 percent. Those proportions are the same in 2021 and 2022, both before and after the disbursal of advance CTC payments. Extending this view to include the first eight weeks following the refund, CTC recipients’ behavior was still consistent year-over-year, transferring 10 percent in 2021 and 12 percent in 2022; non-recipients transferred 11 percent in 2021 and 19 percent in 2022.
Debt payments—to auto loans, mortgages, student loans, non-Chase credit cards, or other loans—while much less responsive to federal tax refunds than spending or transfers, were consistent for both groups year-over-year. In both 2021 and 2022, CTC recipients used only 1 percent of their tax refunds on debt payments within eight weeks of receiving a refund; for non-recipients, 2 percent.
After accounting for spending, transfer, and debt payments, the remainder of the federal tax refund can be thought of as other savings, maintained as cash in the household’s checking and savings accounts. For CTC recipients, the proportion of tax refund kept as other savings was consistent year-over-year: by eight weeks after receiving the tax refund, CTC recipients maintained 50 percent of the refund as cash savings in 2021, and 48 percent in 2022. Non-recipients maintained slightly less of their tax refunds as cash savings in 2022 than they did in 2021. Eight weeks after the refund arrived, non-recipients held 59 percent of the refund as cash in the household’s accounts in 2021, and 54 percent in 2022.
Overall, for both years and both groups, households in our sample consistently saved more than half of their tax refunds as outflow transfers and other savings. This is in-line with the JPMorgan Chase Institute’s prior tax time report, which studied tax refunds between 2015 and 2017 and found that 67 percent of the tax refund amount was still available one month after receipt, measured via increases in cash balances and net savings (net transfers to other accounts). Figures 5 and 6 show that, one month after receiving a federal tax refund, CTC recipients still had 67 percent of the refund available in both years, 2021 and 2022 (9 percent in net outflow transfers and 58 percent in other savings in 2021, for example). This was slightly higher for non-recipients, but still fairly consistent across years, at 70 percent in 2021 and 73 percent in 2022. The consistency across reports in the proportion of tax refunds allocated to transfers and other savings indicates that this behavior is fairly typical over time, and does not represent unusually conservative uses of tax refunds during the immediate post-COVID timeframe of economic uncertainty and high inflation.
Figure 5 : Prior to the advance CTC payments, in the eight weeks following a 2021 federal tax refund, CTC recipients spent 39 percent of the refund, transferred 10 percent to other accounts, and maintained most of the remainder as cash savings; non-recipients spent 28 percent and transferred 11 percent.
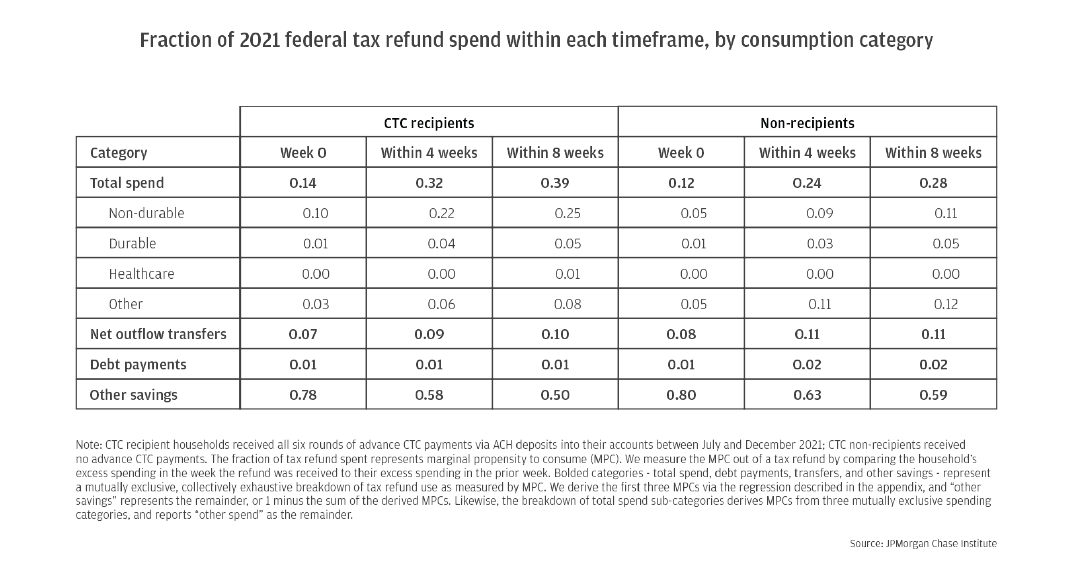
Figure 6 : After the advance CTC payments, in the eight weeks following a 2022 federal tax refund, CTC recipients spent 38 percent of the refund, transferred 12 percent to other accounts, and maintained most of the remainder as cash savings; non-recipients spent 25 percent and transferred 19 percent.
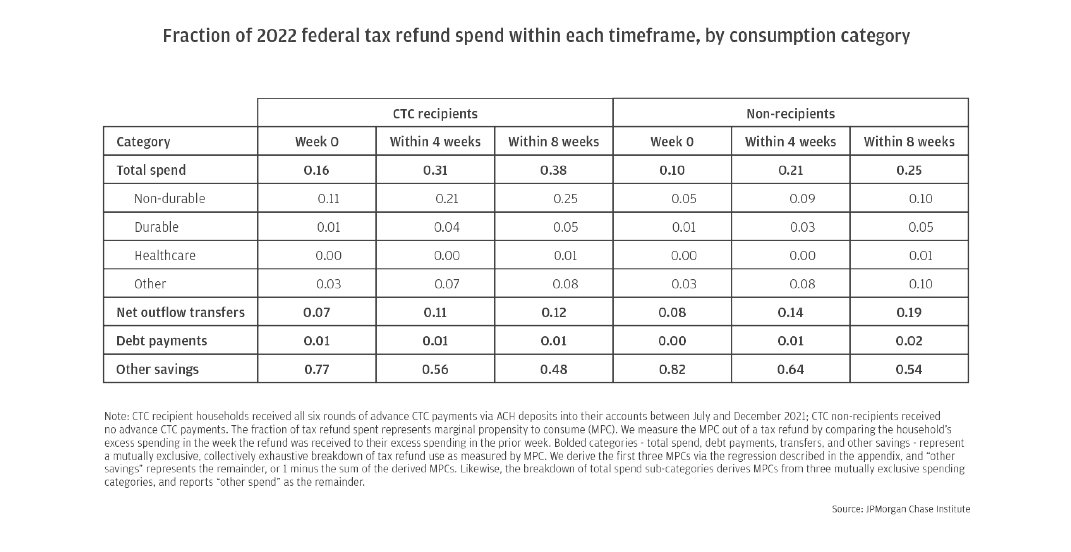
Finally, we differentiate types of spending within the total spending category. Most spending in the eight weeks following a federal tax refund goes toward non-durable goods, which was consistent year-over-year for CTC recipients and non-recipients alike. Spending on non-durable goods accounts for roughly two-thirds of the total spending response for CTC recipients (25 percent of the tax refund in both years) and roughly 40 percent of the total spending response for non-recipients (11 percent of the tax refund in 2021 and 10 percent in 2022).11 Durable goods also exhibit a clear, consistent spending response in both years following receipt of a tax refund, but at notably lower levels (5 percent of the tax refund, for both groups in both years).12
Healthcare spending also increases following tax refund receipt, but while the increase is statistically significant, it is small in magnitude.13 Previous Institute work on deferred care showed that tax refunds can be an important source of liquidity that enables healthcare spending. This raises concern that reduced tax refunds may result in CTC recipients spending less than they would like—less than they would out of a typical tax refund—on healthcare. We see a very small spending response on healthcare in both years, with CTC recipients and non-recipient households spending less than 1 percent of their federal tax refunds on healthcare. In dollar terms, CTC recipients increased their healthcare spending by roughly $7.50 in the week of receiving a federal tax refund in 2021 and 2022, which represented a 33 to 37 percent increase in healthcare spending, relative to the pre-tax-season reference period. For non-recipients, healthcare spending increased by roughly $3.25, or 17 to 21 percent. For both groups, healthcare spending response was consistent year over year, in both dollar terms and MPCs. In other words, we observed no change in healthcare spending out of federal tax refunds following the advance CTC disbursal.
Across categories, our findings indicate that reduced 2022 federal tax refund amounts following the advance CTC payments did not materially change households’ consumption after receiving the tax refund. Households maintained similar spending behaviors prior to and following the disbursal of advance CTC payments.
Compared to households with substantial liquidity, cash-constrained households are more likely to cut spending upon job loss or increase spending after receiving a tax refund (e.g., Farrell et al. 2019). In addition, our prior report found stark differences in spending response to advance CTC payments by household liquidity, showing that CTC recipients with the lowest liquidity spent 73 percent of their payments in the first week, compared to only 19 percent spent by recipients with the highest liquidity. This differential responsiveness to the liquidity boosts provided by the CTC payments raises questions as to whether household liquidity levels might also impact responsiveness to reduced tax refund amounts. To address this, we assess the marginal propensity to consume out of federal tax refunds for households with high liquidity to that of households with low liquidity, comparing across years for CTC recipients and non-recipients. We measure the liquidity of a household by computing its cash buffer—the amount of cash it has on hand divided by its typical spending. By this metric, households with smaller cash buffers are more liquidity-constrained (see the Appendix for details on the construction of our cash buffer metric, as well as how cash buffer compares with income).
We find that the spending response to tax refunds is consistent year-over-year within each cash buffer quartile, for both CTC recipients and non-recipients. For CTC recipients, the households with the lowest liquidity spent an additional $1,300 the week of a federal tax refund in 2021 before the advance CTC payments (compared to $1,240 in 2022 after the advance CTC payments), whereas households with the highest liquidity only spent an additional $170, in both 2021 and 2022. The spending response was much lower for non-recipients, but also roughly consistent year-over-year: households with the lowest liquidity spent an additional $450 the week of a tax refund in 2021 ($470 in 2022), and those with the highest liquidity spent an additional $100 in 2021 (with no additional spending in 2022). The spending response gap between CTC recipients and non-recipients was much larger for households with low liquidity (a gap of $780 or more) than for households with high liquidity (a gap of $170 or less) and is consistent year-over-year. The right-side plot in Figure 7 shows that this triple difference—year-over-year changes in the difference between CTC recipient and non-recipient spending response—is within $100 for each cash buffer quartile. Overall, spending response to tax refunds remained relatively unchanged in 2022 relative to 2021, and that held for households across the liquidity spectrum. In other words, the decrease in federal tax refund amounts following the advance CTC payments did not have a differential impact across liquidity groups.
Figure 7: The tax refund spending response gap between CTC recipients and non-recipients is much larger for households with low liquidity ($780 or more) than for households with high liquidity ($170 or less) and is consistent before (2021) and after (2022) the disbursal of advance CTC payments.
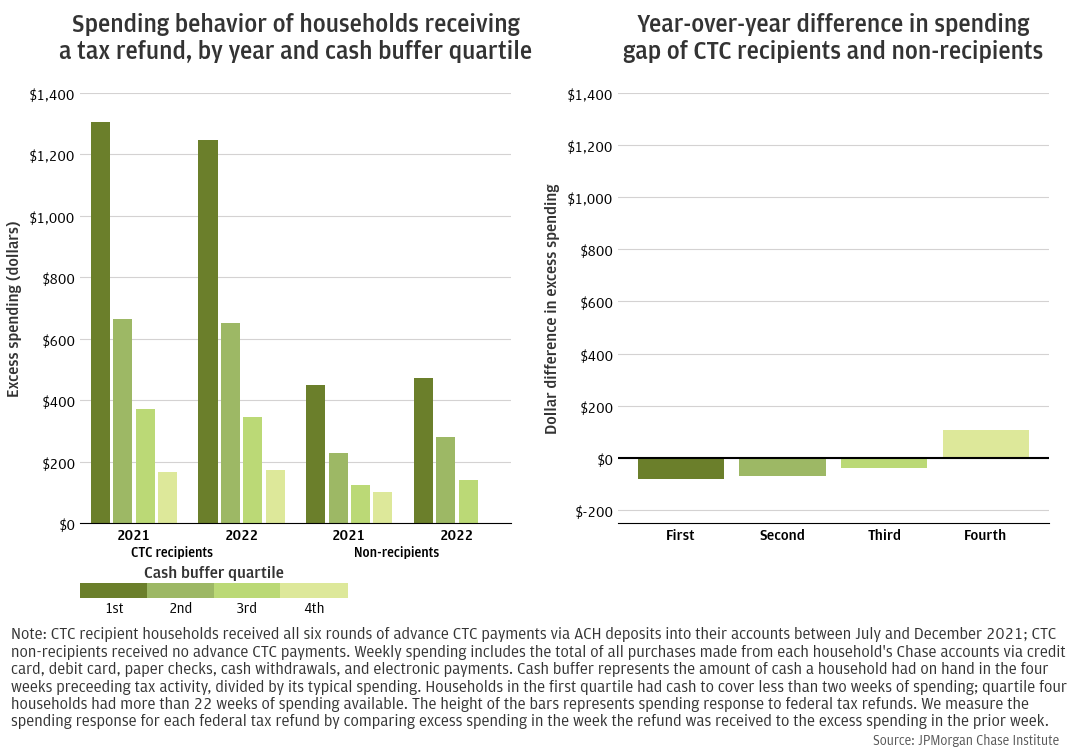
Households with low liquidity were much more responsive to tax refunds than those with high liquidity, but neither exhibited a change in consumption response following the advance CTC payments. As with previous JPMCI work, we continue to see highly differentiated results by household liquidity. Households with low liquidity show a much stronger consumption response to receiving federal tax refunds than households with greater liquidity. But even households with the lowest liquidity did not show year-over-year differences in spending response to federal tax refunds. In other words, even the group most likely to be adversely affected by the reduced tax refund amounts did not appear to be significantly affected.
Lack of response by households to reduced tax refund amounts may suggest that some of the spending response to these routine, expected payments is an inflows-induced spending response rather than deferred demand alone. In the week of tax refund receipt, households spent roughly the same amount in 2021 and 2022, despite the smaller refund amounts in 2022. The disconnect between spending behavior and refund amount may indicate that the spending response observed following tax refunds does not solely represent pent-up consumption demand (i.e., hand-to-month consumption), but may result from households following a rule-of-thumb where income induces spending. The lack of spending declines in response to tax payments is also consistent with this behavioral model.14 Of course, households still had large amounts of excess cash savings in the spring of 2022 , so this lack of response may be unique to the post-pandemic period of high liquidity.
Policymakers interested in supporting household consumption and aggregate spending may consider more frequent disbursal of tax credits to improve household liquidity without being too disruptive to household’s regular tax time behaviors. Our prior report showed that households, especially low-liquidity households, exhibited a strong spending response to the monthly CTC payments during the second half of 2021. This indicates that the monthly benefit disbursement cadence may be preferred by some households. Furthermore, these new results show that the subsequent reduction in federal tax refund amounts did not have a material impact on household spending during tax time. As such, policymakers might consider increasing the frequency of benefit payments going forward. Indeed, other work has indicated that monthly benefit payments may help households smooth consumption more than annual payments (LaPoint and Sakabe 2019).
Alternatively, since households keep a majority of their tax refund dollars in savings, policymakers interested in supporting wealth building could choose to induce savings by making refunds even larger. Families consistently allocate the majority of their tax refunds to transfers and other savings. This behavior has been consistent over time, exhibited both years in this report as well as 2015 through 2017 (Farrell et al. 2019). Given that households appear to be unresponsive to moderate changes in their refund amounts, and they leave most of the refund in savings, policymakers might use these facts to encourage savings, opting to maximize tax-time refund amounts rather than implementing more frequent benefit payments. While redistributing some tax credit dollars to earlier, more frequent payments did not have adverse impacts in the case studied in this report, the reduction in federal tax refund amounts was small relative to the overall size of refunds. Future research might assess whether the penchant for relatively consistent spending would crowd out previously steady saving behavior in the face of a larger redistribution of payments.
Data
Our analysis sample consists of 189,000 households that meet three key criteria. Each household: (1) was included in our sample of recipients and non-recipients of advance CTC payments in 2021, (2) conducted their federal and state taxes via their JPMC accounts in 2020 through 2022, and (3) has members that use their JPMC checking accounts as their primary financial instruments.
We classify households as CTC recipients or non-recipients based on the presence and frequency of CTC payments into their deposit accounts. CTC recipient households received all six rounds of advance CTC payments via ACH deposits into their accounts between July and December 2021. An additional set of households are classified as CTC non-recipients based on receiving no advance CTC payments. Households are excluded from analysis if we cannot confidently determine CTC receipt during the disbursal period. Specifically, our CTC recipient group excludes households that received fewer than six monthly payments or who received inconsistent monthly CTC payment amounts, while our non-recipient group excludes families that received stimulus payments for one or more dependent children in 2020 or 2021. To ensure that our measures of CTC receipt and CTC amounts are accurate, both CTC recipient and non-recipient groups exclude a small share of families that may have received CTC payments in the form of paper checks, because we cannot verify the paper checks with as much certainty as ACH payments.
Likewise, we classify household’s federal and state tax activities based on the presence and frequency of tax-related transactions in their deposit accounts. We identify households that received tax refunds via ACH deposits made into the household’s accounts, and households that made tax payments via ACH payments out of the household’s accounts. For each household in our sample, we observe exactly one federal tax activity—either receiving a refund or making a payment—in each year 2020 through 2022 (i.e., tax years 2019 through 2021), occurring between the start of tax season and two weeks after the tax deadline. Households living in states with state-level income tax must also have a single state tax transaction for each year.
Finally, we use several activity filters to limit our sample to households that use their JPMC accounts as primary financial vehicles. Each household member was an active checking account user between January 2019 and October 2022. Each household has JPMC deposit accounts (not just credit cards), minimum activity of 5 transactions per month, and minimum take-home income of $12,000 for every year 2019 through 2021. To ensure visibility into most of the household’s spending behavior via their JPMC checking and credit card accounts, we limit our sample to households with relatively small (if any) monthly credit card payments to other banks. To ensure representative households, we remove those with demographic outliers (extreme values for age or number of household members). We also exclude families that did not receive Economic Impact Payments (EIP) in both 2020 and 2021. The income eligibility threshold for EIP—$150,000 for joint filers or $75,000 for individual filers—is lower than the eligibility threshold for advance CTC payments, therefore our sample consists of households that are eligible to receive the full CTC amount.
We observe households’ total income and spending across all of their checking and credit card accounts from January 2019 through October 2022. We construct liquidity measures for each household based on the balances held in their checking and savings accounts, relative to their typical spending. See the below Measures section for details.
Household unit of analysis
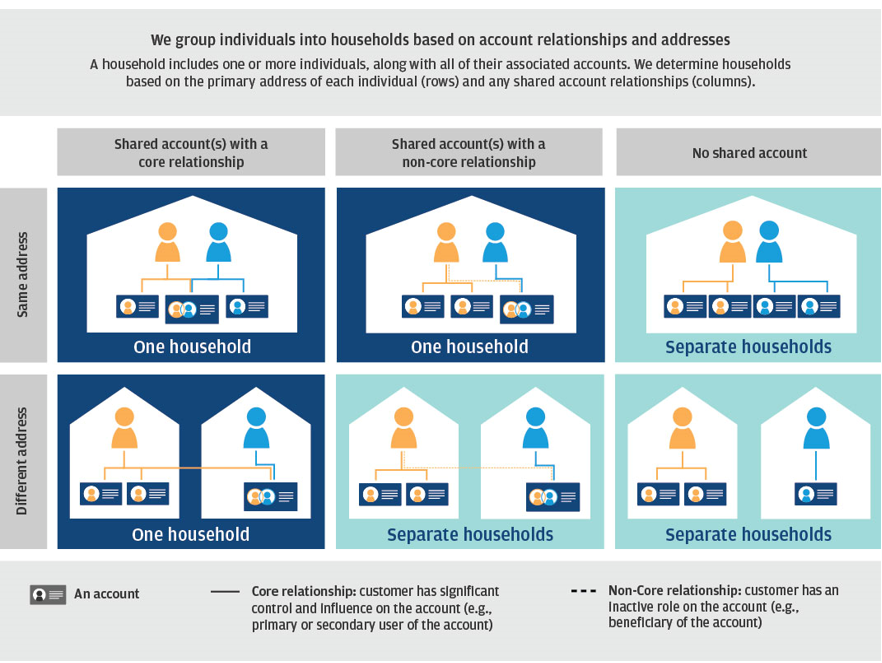
This report utilizes our household unit of analysis, which gives us a comprehensive view into family demographics and finances by allowing us to observe the household composition across all members, and household finances across the full set of accounts associated with any household member.
A household can include one or more individuals, who share a core relationship on at least one of their accounts (e.g., they are primary or secondary account-holders on the same account). When analyzing household finances, we consider all accounts associated with each individual in the household.
Measures
Federal tax amount: The amount of the federal tax transaction (refund or payment) for each household. Tax transactions must occur between the start of tax season and two weeks after the tax deadline. Allowable tax transaction dates are between January 20 and June 1 for 2021, and between January 19 and May 3 for 202215 .
Our regression analyses include federal tax event studies for 2021 and 2022, comparing CTC recipients with non-recipients. We note that by defining CTC recipients as households who received six rounds of ACH CTC payments, we may be biasing that group to 2021 federal tax refund recipients. Because the IRS used 2021 tax filing to determine eligibility and payment of advance CTC disbursals, those advance payments arrived in each household’s accounts via the same channel as the household’s 2021 tax refund or payment. In other words, our identification method for advance CTC payments means that households in our sample conducted their 2021 federal taxes via ACH, which is more commonly in use for households receiving tax refunds than for households making tax payments, possibly biasing our 2021 tax results toward households receiving tax refunds. However, the proportion of CTC recipient households that received federal tax refunds is only slightly higher in 2021 than in 2022, and that proportion moves by the same amount year-over-year for the non-recipient households, thus alleviating the concern. Across years, for both CTC recipients and non-recipients, the majority of households received federal tax refunds (as opposed to making federal tax payments). This is consistent with prior Institute research on taxes. See below for distribution of federal tax amounts for families that received federal tax refunds and families that made federal tax payments, by year and CTC recipiency.
Figure A1 : Proportion of households receiving federal tax refunds or making federal tax payments, by year and CTC recipiency.
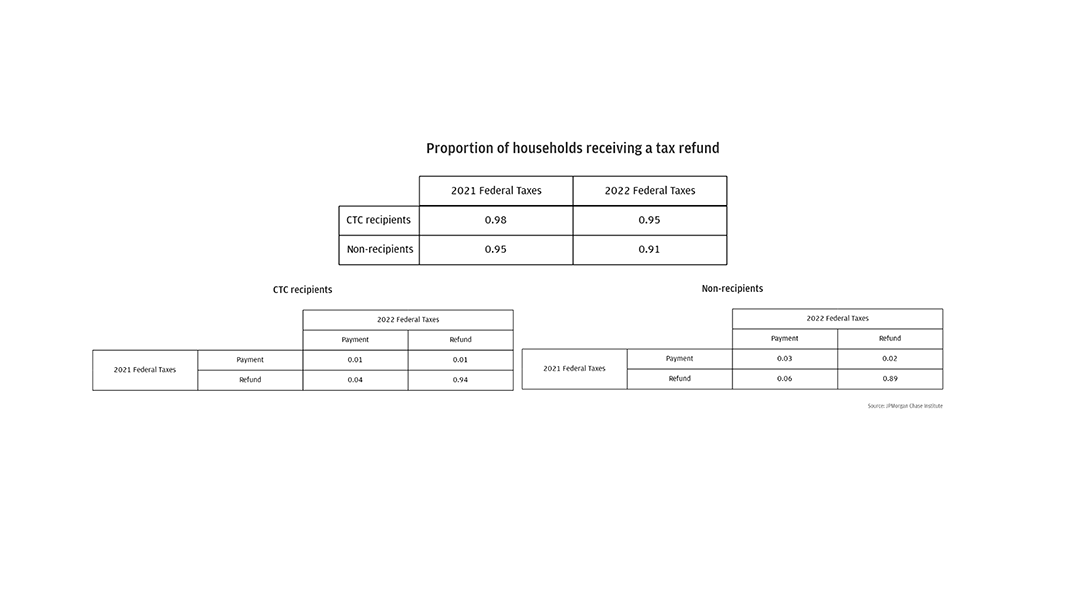
Figure A2: Federal tax amounts for households that received tax refunds.
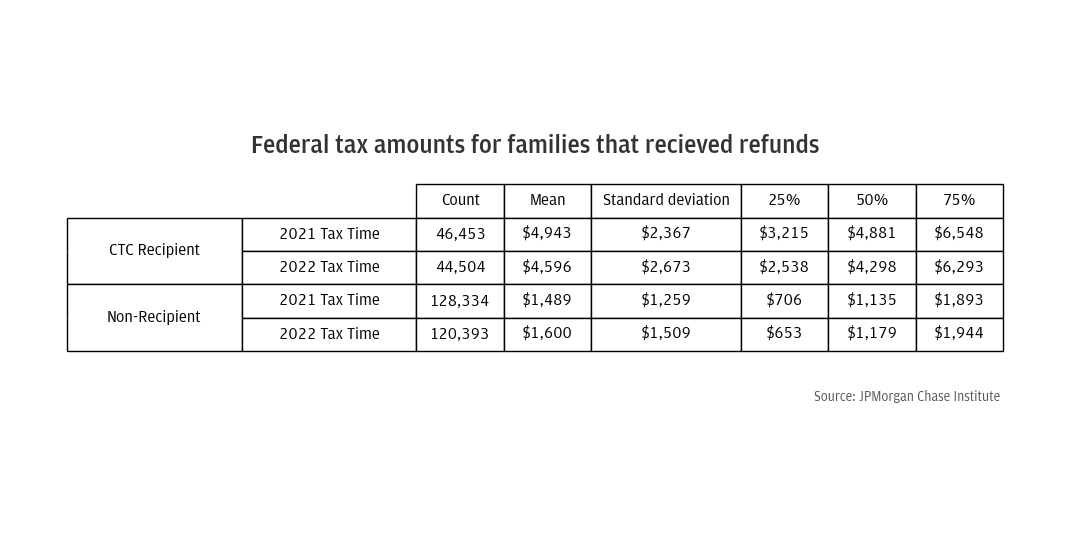
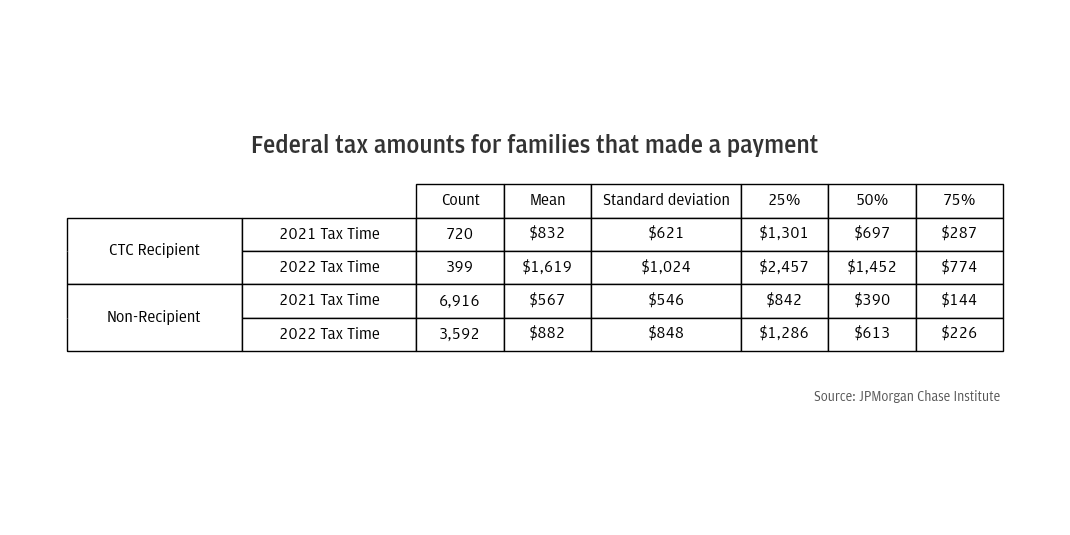
Figure A3 : Federal tax amounts for households that made tax payments.
Income: Measured as total household inflows (excluding transfer inflows) over calendar year 2019 across all of the checking accounts associated with the household. This is, by construction, a measurement of take-home income. As noted above, we remove households with insufficient income from our analysis sample. Household incomes must be at least $12,000 in 2019, 2020, and 2021 and $10,000 in the first ten months of 2022 to be included in our data.
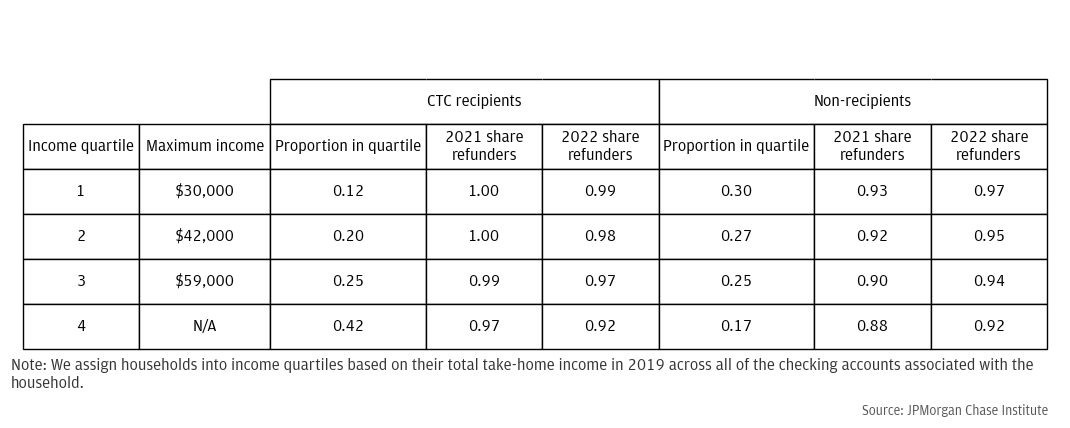
Income quartile: We assign households into income quartiles based on the income metric described above. Income quartiles are defined on the entire sample of households, after applying the filters described in the Data Asset section. This means that CTC recipients are not evenly distributed across income quartiles. See below for income cutoffs, the distribution of our sample across quartiles, and the proportion of households receiving a federal tax refund in each income quartile. Note that income cutoffs are slightly higher than in past Institute research because our household unit of analysis includes more accounts per household.
Figure A4 : Income quartile cutoffs and share of federal tax refund recipients, by year and CTC recipiency.
Cash buffer: A household’s cash buffer measures how long (in weeks) it would take for a household to deplete their cash balances at their typical spending rate. We construct cash buffers for a household by discounting the balance in their accounts by their typical weekly spending. Specifically, a household’s weekly cash buffer is the ratio of median weekly balance to median weekly spending.
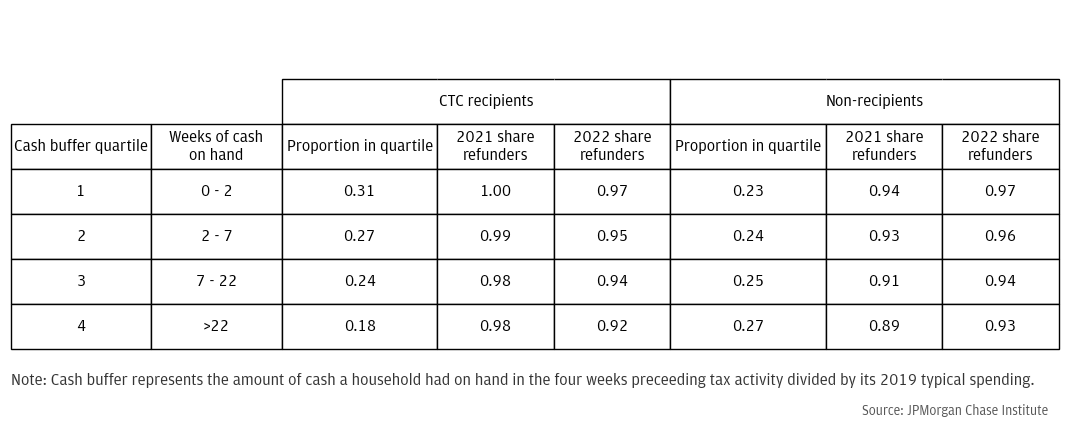
Cash buffer quartile: We assign households into cash buffer quartiles based on the cash buffer metric described above. See below for how many weeks of cash-on-hand each cash buffer quartile represents, the distribution of our sample across quartiles, and the proportion of households receiving a federal tax refund in each cash buffer quartile.
Figure A5 : Cash buffer quartile cutoffs and share of federal tax refund recipients, by year and CTC recipiency.
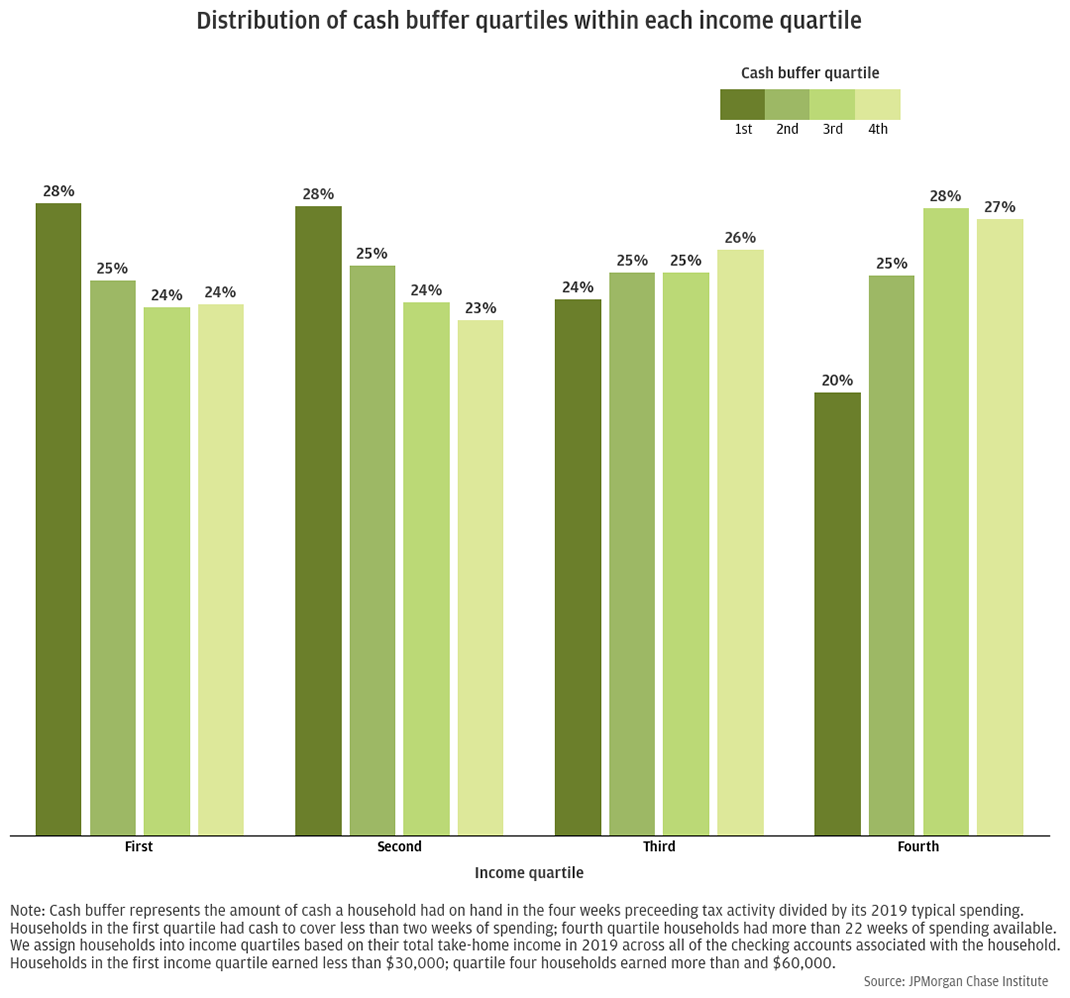
While cash buffer is somewhat correlated with income, they represent distinct concepts. Cash buffer measures how cash-constrained a household is relative to its own spending habits. High-income families often maintain low cash buffers in their checking and savings accounts (either due to higher spending habits than low-income families, or higher rates of transferring funds to other types of accounts). The reverse is also often true, with low-income families maintaining high cash buffers (likely due to having low levels of typical spending). Indeed, 24 percent of the lowest-earning households in our sample are in the highest cash buffer quartile, whereas 20 percent of the highest-earning households are in the lowest cash buffer quartile.
Figure A6 : Distribution of cash buffer quartiles within each income quartile.
Model
Regression specification
We run regressions of the following form:
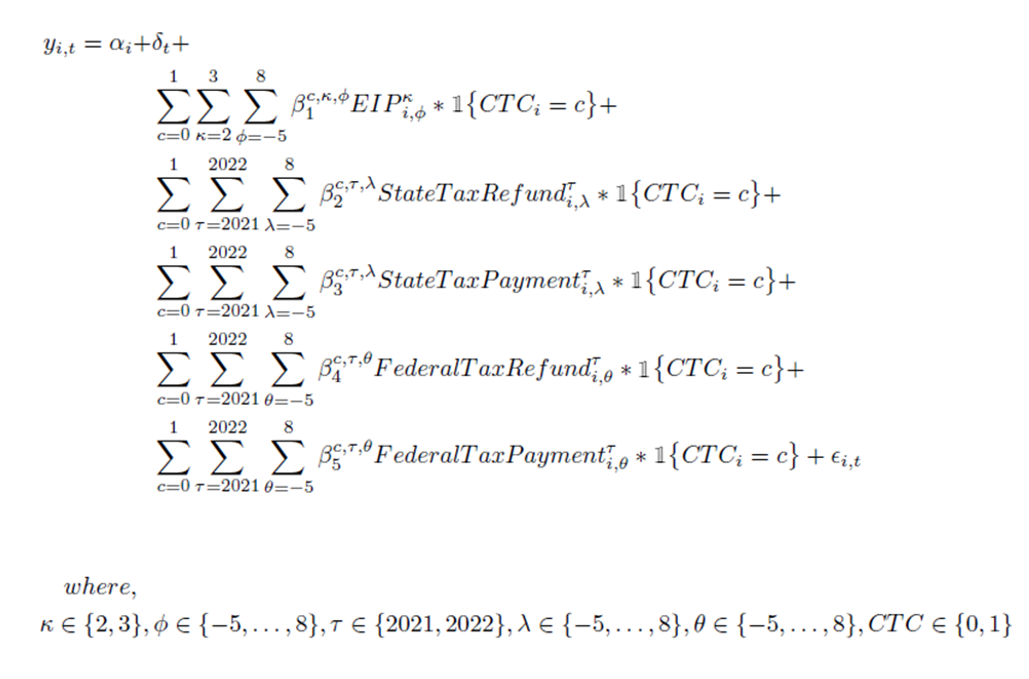
The dependent variable of interest for household i in week t is yit. See below for a full list of the dependent variables used in our analysis. Individual level fixed effects (αi) are at the household level, while time fixed effects (δt) are at the weekly frequency. CTCi represents the household’s CTC recipiency status (1 for recipients, 0 for non-recipients). FederalTaxRefundτi,θ represents the federal tax refund amount by household i in year τ, week θ, where θ is only distinguished from t because t indexes all weeks in the sample while θ only includes five weeks prior to the tax refund through 8 weeks following the tax refund.16 (See Week variables below for additional discussion.) Weeks before the five weeks pre-tax-refund establish the baseline for the dependent variable. Thus, the βc,τ,θ coefficients capture the change in the average of yit in week θ relative to the average in the baseline period. Furthermore, because FederalTaxRefundτi,θ is the dollar amount of the refund received, the unit of measurement of βc,τ,θ is the tax amount itself; that is, βc,τ,θ is the excess spending expressed as a fraction of the tax refund the household received. Analogous terms are included for FederalTaxPaymentτi,θ, StateTaxRefundτi,θ, and StateTaxPaymentτi,θ. The federal payment terms comprise the coefficients of interest for our analysis, and the state payment terms act as controls, accounting for influxes of cash or outflows of funds made by the household unrelated to the federal tax refund or payment of interest. Likewise, we include control terms to account for the influxes of cash provided by stimulus payments. EIPκi,ϕ represents the stimulus amount received by household i in EIP round κ, week ϕ. Finally, εit represents the error term.
We also estimate similar specifications where the β and δ coefficients are allowed to vary by liquidity, which allows us to measure separate federal tax responses for each liquidity group.
As discussed below, we use analytic weights in each regression to account for underlying differences in household characteristics between CTC recipients and non-recipients. We also cluster standard errors at the household level.
Dependent variables
To assess a complete picture of household consumption, we study several dependent variables.
Accounting for credit card spending: Note that credit cards show up in two of our dependent variables, total spending and debt payments. The distinction here is Chase vs. non-Chase cards. We can observe any spending charged to a Chase credit card at the transaction level. We see the transaction date and category and can therefore include these transactions alongside other weekly spending categories. On the other hand, we cannot see details of how customers use their non-Chase credit cards. We can only observe the presence of other credit cards when a payment is made from a household’s Chase account to the non-Chase credit card bill. We therefore classify these payment transactions as debt payments, since the spending occurred prior and the payment represents paying down the debt owed to the credit card. We do not count payments toward non-Chase credit card bills as spending, since we do not know when or how the spending occurred, nor how much of the payment covers older debts on the card. Likewise, we do not count payments toward Chase credit card bills as debt payments, as we have already included this activity in our spending metrics.
Week variables
As noted in the regression specification, the independent variables of interest are household-level federal and state tax amounts, stimulus payment amounts, and weekly dummy variables. Consistent with our prior CTC report , we construct our weeks to run Wednesday through Tuesday.
Our analysis sample includes weekly data for each household allowing at least 9 weeks of data prior to the earliest tax transaction and at least 8 weeks of data following the latest tax transaction (see Measures section above for allowed tax date ranges). This results in weekly data spanning November 18, 2020, through July 27, 2021, and November 17, 2021, through June 28, 2022, for each household in our sample. In each year, the weeks earlier than five weeks before the household’s tax transaction serve as a reference period, during which typical spending behavior is established. When plotting the impulse response (βc,τ,θ) we calculate the average of the βc,τ,θ during the five weeks prior to the tax transaction and subtract that average from each point in the plot, to level-set the series.
Weights
When regressing, we apply weights to non-CTC-recipient households so that their demographics mimic those of the CTC recipients on key dimensions that differentiate households with and without children. We include three factors in this weighting scheme:
We compute weights based on the joint distribution of these three variables, as observed in CTC recipient households17 . For a target proportion based on the joint distribution in the CTC recipient group, and an actual proportion based on the joint distribution in the non-recipient group, household-level weights for non-recipient households are calculated as:
Weight=(Target proportion)/(Actual proportion)
Modeling sample
Prior to performing regressions, we apply additional filters to our analysis sample. We remove households with extreme values of any dependent variable of interest (i.e., households with values in the highest half-percent of the distribution for at least one dependent variable)18 . Finally, we remove households with extreme values of our weighting variables, specifically households with more than two adults.
Baugh, Brian, Itzhak Ben-David, Hoonsuk Park, Jonathan A. Parker. 2018. “Asymmetric Consumption Smoothing.” National Bureau of Economic Research Working Paper 25086. http://www.nber.org/papers/w25086
Farrell, Diana, Fiona Greig, and Amar Hamoudi. "Tax Time: How Families Manage Tax Refunds and Payments." JPMorgan Chase Institute. 2019. https://www.jpmorganchase.com/content/dam/jpmc/jpmorgan-chase-and-co/institute/pdf/institute-tax-time-report-full.pdf
Karpman, Michael, Elaine Maag, Genevieve M. Kenney, and Douglas A. Wissoker. 2021. “Who Has Received Advance Child Tax Credit Payments, and How Were the Payments Used? Patterns by Race, Ethnicity, and Household Income in the July–September 2021 Household Pulse Survey.” Urban Institute. https://www.urban.org/sites/default/files/publication/105023/who-has-received-advance-ctc-payments-and-how-were-the-payments-used.pdf
LaPoint, Cameron, Shogo Sakabe. 2019. “Coming in at a Trickle: The Optimal Frequency of Public Benefit Payments.” Available at SSRN: https://ssrn.com/abstract=3468318
Pilkauskas, Natasha and Patrick Cooney. 2021. “Receipt and Usage of Child Tax Credit Payments Among Low-Income Families: What We Know.” Poverty Solutions. https://sites.fordschool.umich.edu/poverty2021/files/2021/10/PovertySolutions-Child-Tax-Credit-Payments-PolicyBrief.pdf
Pilkauskas, Natasha, Katherine Michelmore, Nicole Kovski, and H. Luke Shaefer. 2022. “The Effects of Income on the Economic Wellbeing of Families with Low incomes: Evidence from the 2021 Expanded Tax Credit”. NBER Working Paper 30533. https://www.nber.org/system/files/working_papers/w30533/w30533.pdf
Wheat, Chris, Erica Deadman, Daniel M. Sullivan. 2022. “How families used the advanced Child Tax Credit.” JPMorgan Chase Institute. https://www.jpmorganchase.com/institute/all-topics/financial-health-wealth-creation/how-families-used-advanced-CTC
We thank our research team, specifically Bernard Ho and Lucas Nathe, for their hard work and contribution to this research. Additionally, we thank Alfonso Zenteno and Robert Caldwell for their support. We are indebted to our internal partners and colleagues, who support delivery of our agenda in a myriad of ways, and acknowledge their contributions to each and all releases.
We are also grateful for the invaluable constructive feedback we received from external experts and partners. We are deeply grateful for their generosity of time, insight, and support.
We would like to acknowledge Jamie Dimon, CEO of JPMorgan Chase & Co., for his vision and leadership in establishing the Institute and enabling the ongoing research agenda. We remain deeply grateful to Peter Scher, Vice Chairman, Tim Berry, Head of Corporate Responsibility, Heather Higginbottom, Head of Research & Policy, and others across the firm for the resources and support to pioneer a new approach to contribute to global economic analysis and insight.
This material is a product of JPMorgan Chase Institute and is provided to you solely for general information purposes. Unless otherwise specifically stated, any views or opinions expressed herein are solely those of the authors listed and may differ from the views and opinions expressed by J.P. Morgan Securities LLC (JPMS) Research Department or other departments or divisions of JPMorgan Chase & Co. or its affiliates. This material is not a product of the Research Department of JPMS. Information has been obtained from sources believed to be reliable, but JPMorgan Chase & Co. or its affiliates and/or subsidiaries (collectively J.P. Morgan) do not warrant its completeness or accuracy. Opinions and estimates constitute our judgment as of the date of this material and are subject to change without notice. No representation or warranty should be made with regard to any computations, graphs, tables, diagrams or commentary in this material, which is provided for illustration/reference purposes only. The data relied on for this report are based on past transactions and may not be indicative of future results. J.P. Morgan assumes no duty to update any information in this material in the event that such information changes. The opinion herein should not be construed as an individual recommendation for any particular client and is not intended as advice or recommendations of particular securities, financial instruments, or strategies for a particular client. This material does not constitute a solicitation or offer in any jurisdiction where such a solicitation is unlawful.
Suggested Citation: Wheat, Chris. Erica Deadman, Daniel M. Sullivan. 2024. “How did advance Child Tax Credit payments affect households’ 2021 tax year outcomes and spending response?” JPMorgan Chase Institute. https://www.jpmorganchase.com/institute/research/household-income-spending/how-families-used-advanced-CTC
For the 2021 tax year, ARPA increased the Child Tax Credit amount from $2,000 to $3,600 for children under age 6 and to $3,000 for other eligible children, expanding eligibility to include 17-year-olds. Families were automatically enrolled to receive 50 percent of the credit via monthly payments between July and December 2021 if the IRS processed their 2020 or 2019 tax return before the end of June 2021. Non-filers also received the advance payments if they had entered their information in 2020 to receive stimulus payments, or if they entered their information in 2021 via IRS non-filer tool. The IRS provided a channel to opt out of advance CTC payments for families that preferred to receive the full tax credit when filing their 2021 tax returns:
https://www.irs.gov/credits-deductions/advance-child-tax-credit-payments-in-2021
For additional details on the advance payments, refer to Wheat et al. (2022).
In our previous report—How families used the advanced Child Tax Credit—our transaction-level data showed that the average household spent 40 percent of their first advance CTC payment within one week, transferred 18 percent to other accounts, and held 41 percent as cash in their bank accounts. However, CTC recipients with low liquidity used a larger portion of their CTC payment on spending and debt payments and maintained very little (2 percent) as cash savings, whereas recipients with high liquidity left the majority (70 percent) of their CTC payment untouched.
The Impact of the 2021 Expanded Child Tax Credit on Child Poverty: https://www.census.gov/library/working-papers/2022/demo/SEHSD-wp2022-24.html
That is, the tax-time CTC amount decreased by $500 per child aged 6 to 17 years. In general, a household’s tax-time CTC amount decreased in 2022 relative to 2021 based on the age and number of children in the household. In 2021, households received a $2,000 tax credit for all eligible children. In 2022, households received $3,600 per child under the age of 6, half of which was disbursed via the advance monthly CTC payments. So, the tax-time CTC amount for children under age 6 was $1,800 in 2022, representing a $200 decrease relative to the tax-time CTC amount in 2021. Likewise, with a 2022 total CTC amount of $3,000 for children 6-17 years of age, the tax-time CTC amount in 2022 decreased by $500 for these children relative to 2021 ($1,500 vs. $2,000). So, the tax-time CTC decrease for any household can be calculated as:
$200 * (number of children under 6 years) + $500 * (number of children 6-17 years)
See Figure 1 for amount of 2022 tax-time CTC decrease by household composition and prevalence in our sample.
Despite increasing the total amount of the credit, ARPA also distributed half of the new amount in advance payments. Because the overall increase less than doubled the total credit, the remaining half of the credit available at tax time in 2022 would be smaller than the previous amount of the credit received at tax time in 2021.
We did not directly compare with 2022 tax amounts because other changes since 2021—in the tax code or in family circumstances—could result in tax amount differences between the two years. The analysis we performed ensured that we did not misattribute other changes in tax amount to be due to the advance CTC payments.
For details on how credit card transactions are handled, see the Dependent Variables discussion in the Appendix.
In other words, we are using a triple diff-in-diff.
We define a “net outflow transfers” metric by calculating the amount of cash transferred out of the household’s checking and savings accounts into other accounts, net of the amount of cash transferred into the household’s accounts from other accounts. Within this sample, there are some potential inconsistencies in the tagging of these labels. These transactions affect both our baseline and our estimated spending response and as a result, these are unlikely to substantively affect results or implications.
Non-durable spending includes cash withdrawals and spending on clothing, department stores, restaurants, transit, utilities, fuel, and groceries.
Durable spending includes spending on auto repair, home improvement, entertainment, and insurance.
Healthcare spending includes spending on drug stores, hospitals, and other healthcare.
See Baugh et al. (2021), who also find an asymmetric response to tax payments and refunds, for a discussion of prevailing models of household consumption smoothing behavior.
End dates differ due to a Tax Day extension in 2021, which moved the tax deadline to May 17, 2021. In contrast, the 2022 deadline was at the usual mid-April timing, with Tax Day falling on April 18, 2022.
https://www.irs.gov/newsroom/tax-day-for-individuals-extended-to-may-17-treasury-irs-extend-filing-and-payment-deadline
For items showing regression output in dollar response rather than marginal propensity to consume, FederalTaxRefundτi,θ represents an indicator that the federal tax refund for household i in year τ occurred in week θ; likewise for dollar response results for households making federal tax payments, FederalTaxPaymentτi,θ.
By definition, weights will be exactly 1 for all CTC recipient households.
We also filter out households in the lowest half-percent of the distribution for net outflow transfers, which is the only dependent variable that can take negative values.
Authors

Chris Wheat
President, JPMorganChase Institute

Erica Deadman
Consumer Research Lead, JPMorganChase Institute

Daniel M. Sullivan
Consumer Research Director, JPMorganChase Institute