Findings

Americans experience tremendous income volatility, and that volatility is on the rise. Income volatility matters because it is hard to manage. The typical household faces a shortfall in the financial buffer necessary to weather this volatility. Moreover, the decline in real wages since 2009 for all income groups except the top 5th percentile means that life is harder to afford in general, but even more so when earnings dip below average. Rapidly growing online platforms, such as Uber and Airbnb, have created a new marketplace for work by unbundling a job into discrete tasks and directly connecting individual sellers with consumers. These flexible, highly accessible opportunities to work have the potential to help people buffer against income and expense shocks. The “Online Platform Economy” offers fewer worker protections than traditional work arrangements, however, which has led some to claim that the Online Platform Economy represents a fundamental shift in the nature of work.

This report from the JPMorgan Chase Institute digs deeper into the demographics and sources of income volatility and provides an unprecedented look at the impact of the Online Platform Economy. This analysis relies on high-frequency data from a randomized, anonymized sample of 1 million Chase customers between October 2012 and September 2015. To examine the Online Platform Economy, we assembled the largest sample of platform workers to date—a dataset of over 260,000 individuals who have offered goods or services on one of 30 distinct platforms.

Part I: Income Volatility Among U.S. Individuals

01

Income volatility, prevalent across the board, was most marked among the young, those in the bottom income quintile, and those living in the West.

The percentage of people who experienced more than a 30 percent month-to-month change in total income:

Infographic describes about the percentage of people who experienced more than a 30 percent month-to-month change in total income

Finding One

Demographic Attributes of People who Experience the Most Income Volatility

Demographic attribute Percent of people who experienced more than a 30
percent month-to-month change in total income
Ages 18-24 70%
Bottom Income 74%
People in the West 60%
National Average 55%

The vast majority of people aged 18-24, individuals in the bottom income quintile, and people living in the West experienced on average more than a 30 percent month-to-month change in total income.

01

Median income individuals experienced nearly $500 in labor income fluctuations across months, with spikes in earnings larger but less frequent than dips.

Median income individuals experienced nearly $500 in labor income fluctuations across months, with spikes in earnings larger but less frequent than dips.

Infographic describes about Median income individuals experienced nearly $500 in labor income fluctuations across months, with spikes in earnings larger but less frequent than dips.

Finding Two

The mean monthly change in labor income was $475 for median-income earners.

The typical person experienced dips in income 43 percent of the time and spikes in income 33 percent of the time, and spikes were 67 percent larger in magnitude than dips.

01

Most of the month-to-month volatility in take-home pay (86 percent) came from variation in pay within distinct jobs.

01

Almost four in 10 individuals experienced a job transition in a given year, contributing 14 percent of the month-to-month volatility in labor income.

Sources of Monthly Changes in Labor Income

Infographic describes about Sources of Monthly Changes in Labor Income

Findings Three and Four

Sources of Labor Income Volatility

Employment status Contribution to month-to-month percent change in labor income
Staying in the same job 86%
Job transition* 14%

* Almost 4 in 10 individuals experienced a job transition over the course of a year.

Sources of variation Percent of within-job volatility
Variation in paycheck amount (bonus, hours, etc.) 72%
Variation in paycheck frequency (e.g. five-Friday month) 28%

Median individuals experienced a $1,108 change in monthly income when they gained or lost a job and $830 when they switched jobs.

As a fast-growing and highly accessible new marketplace for work, many have characterized the Online Platform Economy as the “future of work.” We define the Online Platform Economy as economic activities involving an online intermediary that provides a platform by which independent workers or sellers can sell a discrete service or good to customers. Labor platforms, such as Uber or TaskRabbit, connect customers with freelance or contingent workers who perform discrete projects or assignments. Capital platforms, such as eBay or Airbnb, connect customers with individuals who rent assets or sell goods peer-to-peer.

Infographic describes about Online Platform Economy Attributes

Part II:

Online Platform Economy Attributes

  • Connects workers or sellers directly to customers
  • Allows people to work when they want
  • Sellers are paid for a single task or good at a time
  • Payment passes through the platform

Labor Platforms: Participants perform discrete tasks

Capital Platforms: Participants sell goods or rent assets

Part II: The Online Platform Economy

As a fast-growing and highly accessible new marketplace for work, many have characterized the Online Platform Economy as the “future of work.” We define the Online Platform Economy as economic activities involving an online intermediary that provides a platform by which independent workers or sellers can sell a discrete service or good to customers. Labor platforms, such as Uber or TaskRabbit, connect customers with freelance or contingent workers who perform discrete projects or assignments. Capital platforms, such as eBay or Airbnb, connect customers with individuals who rent assets or sell goods peer-to-peer.

Infographic describes about Online Platform Economy Attributes

Part II:

Online Platform Economy Attributes

  • Connects workers or sellers directly to customers
  • Allows people to work when they want
  • Sellers are paid for a single task or good at a time
  • Payment passes through the platform

Labor Platforms: Participants perform discrete tasks

Capital Platforms: Participants sell goods or rent assets

01

Although 1 percent of adults earned income from the Online Platform Economy in a given month, more than 4 percent participated over the three-year period.

Infographic describes about Although 1 percent of adults earned income from the Online Platform Economy in a given month, more than 4 percent participated over the three-year period

Finding Five

In any given month, 0.4 percent of adults participated in labor platforms and 0.6 percent of adults participated in capital platforms. In total, 1.0 percent of adults participated in the Online Platform Economy in September 2015—a 10-fold growth since October 2012.

Cumulatively, 0.9 percent of adults had at one point participated in labor platforms and 3.3 percent of adults had at one point participated in capital platforms. In total, 4.2 percent of adults had ever participated in the Online Platform Economy in September 2015—a 47-fold growth since October 2012.

01

The Online Platform Economy was a secondary source of income, and participants did not increase their reliance on platform earnings over time.

Although the sheer number of people participating increased rapidly, reliance on platforms remained stable over time in terms of both the fraction of months that participants were active and the fraction of total income earned on platforms in active months.

Infographic describes about the Online Platform Economy was a secondary source of income, and participants did not increase their reliance on platform earnings over time

Finding Six

  • Labor platform participants were active 56% of the time. While active, platform earnings equated to 33% of total income.
  • Capital platform participants were active 32% of the time. While active, platform earnings equated to 20% of total income.

Although the sheer number of people participating has increased rapidly, reliance on platforms remained stable over time in terms of both the fraction of months that participants are active and the fraction of total income earned on plat- forms in active months.

01

Earnings from labor platforms offset dips in non-platform income, but earnings from capital platforms supplemented non-platform income.

Individuals relied on labor platform work not only when outside income dipped but also when they were between jobs. Labor platform participants were less likely to be employed in a traditional job in months when they were generating platform earnings (69 percent employed) compared to months when they were not (62 percent employed).

Infographic describes about earnings from labor platforms offset dips in non-platform income, but earnings from capital platforms supplemented non-platform income

Finding Seven

Labor platform earnings contribute an additional 15% of income to total non-platform income. In months with platform earnings, non–platform earnings were approximately 14% lower, so that 15% of platform earnings created an overall increase of 1% in total income.

Capital platform earnings contribute an additional 7% of income to total non-platform income. Among capital platform participants, non-platform earnings were similar in months with and without platform earnings, so that 7% of platform earnings created an overall increase of 7% in total income

Data

Infographic describes about constructing our samples, Identifying income and jobs

Data

Constructing our samples:

From a universe of 28 million people, we identified 6 million people who held a checking account in every month between October 2012 and September 2015, and had at least 5 outflows in each of those months. That sample of 6 million people was separated into two sections: a random sample of 1 million people, and a 260,000-person sample of people in the Online Platform Economy who received income from at least one of 30 distinct online platforms.

Identifying income and jobs:

We studied 1.9 billion inflow transactions, including information about their amounts, dates and times, descriptions, and channels. These were categorized into the following components: labor income (payroll, other direct deposit), capital income (annuities, dividends, interest income), government income (tax refunds, unemployment, Social Security), and other income (ATM deposits, unclassified income). We also identify job transitions and job pay attributes, including paycheck amounts and pay frequency.

Conclusion

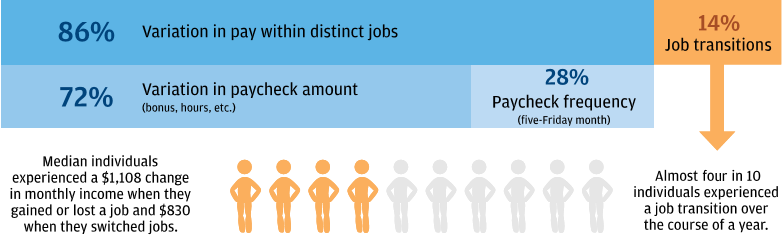
The findings in this report underscore the importance of asset building so that families have enough liquidity to weather volatility in income and spending. Key, predictable savings opportunities include December to March pay spikes, five-Friday months for individuals with jobs that pay every two weeks or weekly, and tax season for those who receive tax refunds. The five-Friday effect also reveals a structural disconnect between typical employer pay cycles and billing cycles. Eighty percent of individuals received an extra paycheck in five-Friday months because they held a job that paid every two weeks or weekly. Meanwhile, 40 percent of expenditures, including rent payments and installment loans, have a fixed per-month expense regardless of the number of days in that month. These fixed costs are potentially easier to cover during, or shortly after, months with an extra paycheck. Employers, financial institutions, utilities, and landlords can ameliorate this mismatch by offering paycheck cycles that sync with payment cycles or vice versa. 

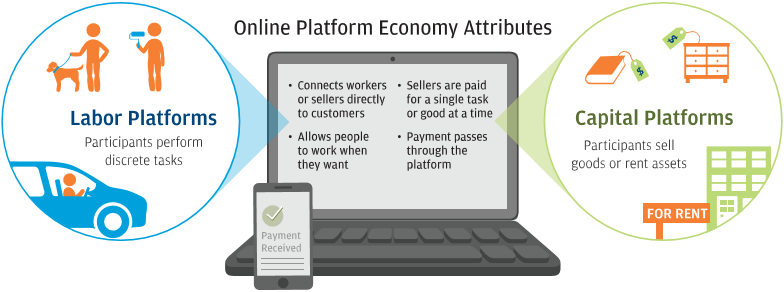
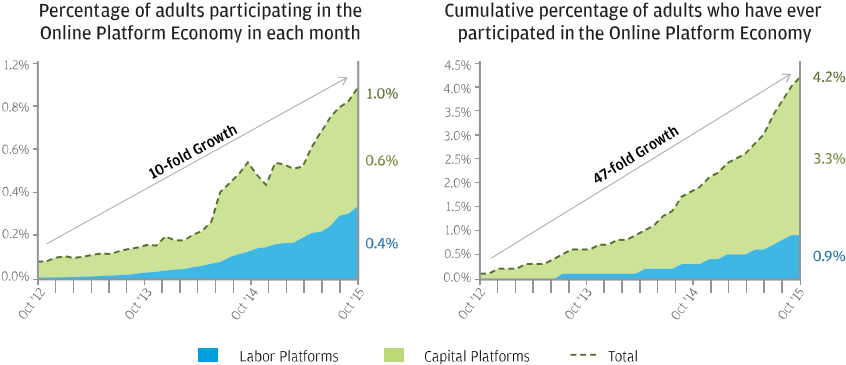
This study is the first of its kind to shed light on the Online Platform Economy using financial transactions, and provides an important foundation for the many policy and economic debates related to what some have termed the “future of work.” Over the three years of our study (October 2012 to September 2015), 4.2 percent of adults, an estimated 10.3 million people—more than the total population of New York City—earned income on the platform economy. This number increased 47-fold over the three years. We distinguish between labor platforms and capital platforms and find that, although labor platforms grew more rapidly than capital platforms, participation on capital platforms was more than 60 percent higher than participation on labor platforms. Although the sheer number of people participating grew rapidly, platform earnings remained a secondary source of income, and reliance on platform earnings did not increase for individuals over time.

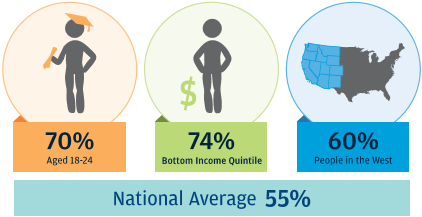
The Online Platform Economy adds an important new element to existing labor markets, however. Simply put, landing a platform job is easier and quicker. Individuals can, and do, generate additional income on labor platforms in a timely fashion when they experience a dip in regular earnings. This is a potentially far better option to mitigate or weather volatility, if the alternatives are to constrain spending or take on additional credit. Moreover, this option meets a target need. Participation in labor platforms is highest precisely among those who experience the highest levels of income volatility—the young, the poor, and individuals living in the West. 

Authors

Diana Farrell

Diana Farrell

Founding and Former President & CEO

Fiona Greig

Fiona Greig

Former Co-President