Findings

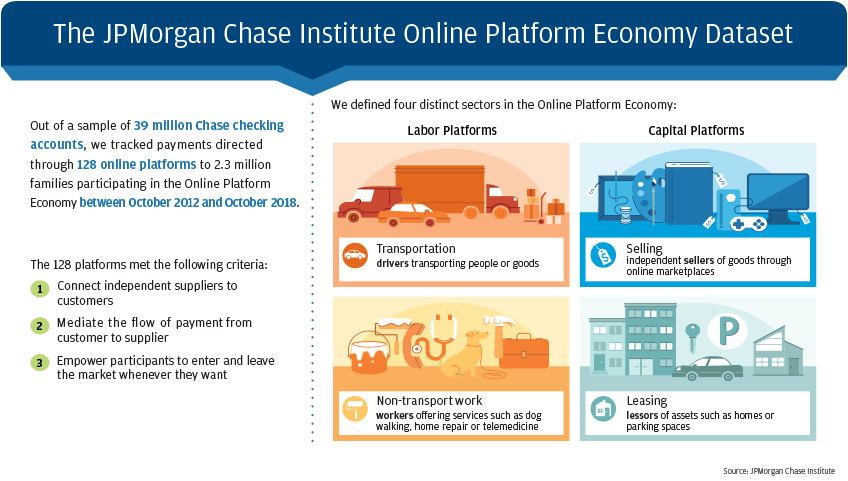
A significant and growing fraction of families generate income through the Online Platform Economy. In recent JPMorgan Chase Institute research, we leveraged administrative banking records to track supply-side participation and revenues in the Online Platform Economy, and observed strong secular trends in two sectors between 2013 and 2018:

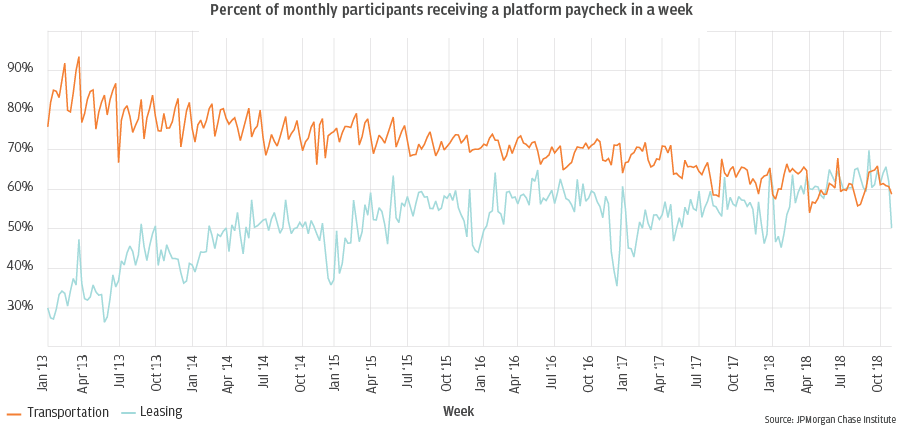
  • Participation on transportation platforms—measured as the fraction of our sample generating income through a transportation platform in any given month—increased by more than a factor of 20, while average monthly revenues declined by half.
  • Participation on leasing platforms tripled while average monthly revenues doubled.

We also reported large differences in participation rates across metropolitan areas.

In this follow-up research, we use geographic and temporal variation to explore these dynamics in more detail, in order to get a better understanding of the viability of the transportation and leasing sectors of the Online Platform Economy as a potential source of income for participant families. We explore variation in characteristics of the Online Platform Economy over five years across 27 metropolitan areas in order to answer four questions.

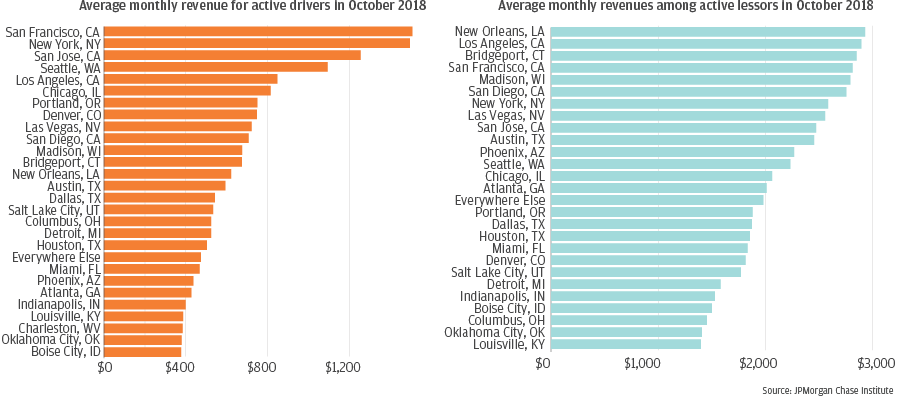
  • Given the geographic variation in platform participation, how do revenues vary across metro areas?
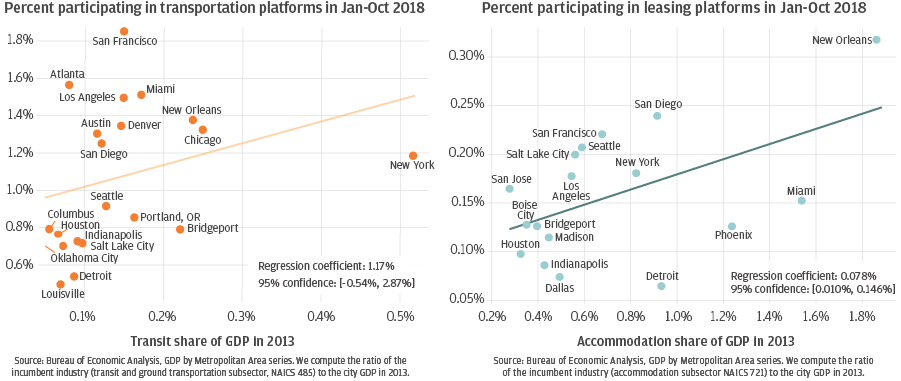
  • What are local correlates of platform participation and revenues, which may point to factors accounting for the cross-area variation we see?
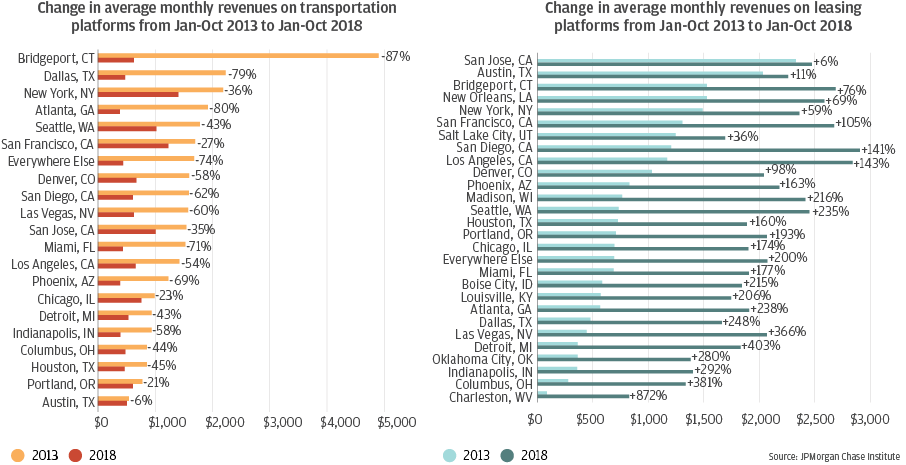
  • What do the sample-wide secular trends in participation and revenues say about local metropolitan area trends—do they reflect changes in just a few metro areas, or do they tell a story that is consistent across metro areas?
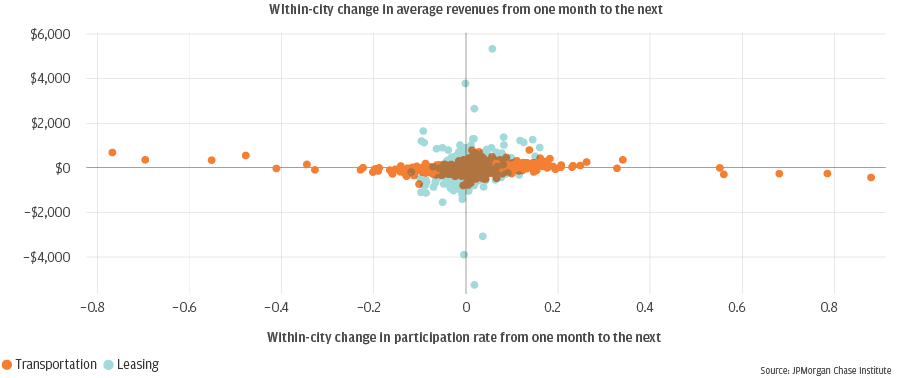
  • How do revenue prospects and participation rates interact—for example, did the increase in participation in the transportation sector create the decline in average monthly driver revenues?

In answering these questions, we focus on transportation and leasing sectors of the Online Platform Economy, as they are most influenced by local supply and demand conditions, compared with non-transport work and selling (the other two sectors on which we have previously reported).

Our findings imply that there is still room for supply-side growth in both sectors. However, they have implications for would-be full time drivers. Taken together, our findings raise important questions about policy options to improve income prospects of current and potential participants in the Online Platform Economy. Our findings are as follows.

01

There is significant variation across metropolitan areas in terms of participation rates, average monthly revenues, and levels of engagement in the leasing and transportation sectors of the Online Platform Economy. Participation and revenues are positively correlated but there are telling exceptions to that pattern.

Bar graph1 describes about Average monthly revenue for active driversin October 2018 and Bar graph2 describes about Average monthly revenues among active lessors in October 2018

Finding One

There is significant variation across metropolitan areas in terms of participation rates, average monthly revenues, and levels of engagement in the leasing and transportation sectors of the Online Platform Economy. Participation and revenues are positively correlated but there are telling exceptions to that pattern.

City Average monthly revenue for active drivers in October 2018
San Francisco, CA $1,508
New York, NY $1,496
San Jose, CA $1,255
Seattle, WA $1094
Los Angeles, CA $848
Chicago, IL $815
Portland, OR $750
Denver, CO $747
Las Vegas, NV $722
San Diego, CA $707
Madison, WI $675
Bridgeport, CT $674
New Orleans, LA $622
Austin, TX $594
Dallas, TX $543
Salt Lake City, UT $534
Columbus, OH $524
Detroit, MI $523
Houston, TX $504
Everywhere Else $473
Miami, FL $468
Phoenix, AZ $437
Atlanta, GA $427
Indianapolis, IN $399
Louisville, KY $387
Charleston, WV $384
Oklahoma City, OK $380
Boise City, ID $378


City Average monthly revenue among active lessors in October 2018
New Orleans, LA $2,929
Los Angeles, CA $2,892
Bridgeport, CT $2,848
San Francisco, CA $2,812
Madison, WI $2,791
San Diego, CA $2,752
New York, NY $2,583
Las Vegas, NV $2,555
San Jose, CA $2,471
Austin, TX $2,452
Phoenix, AZ $2,265
Seattle, WA $2,231
Chicago, IL $2,060
Atlanta, GA $2,010
Everywhere Else $1,978
Portland, OR $1,878
Dallas, TX $1,872
Houston, TX $1,852
Miami, FL $1,832
Denver, CO $1,814
Salt Lake City, UT $1,769
Detroit, MI $1,579
Indianapolis, IN $1,527
Boise City, ID $1,499
Columbus, OH $1,453
Oklahoma City, OK $1,404
Louisville, KY $1,396
01

Metropolitan areas with larger incumbent industries as the Online Platform Economy emerged ended up with higher participation and higher average revenues in the corresponding platform sectors.

Line graph1 describes about Percent participating in transportation platforms in Jan-Oct 2018 and Line graph2 describes about Percent participating in leasing platforms in Jan-Oct 2018

Finding Two

Metropolitan areas with larger incumbent industries as the Online Platform Economy emerged ended up with higher participation and higher average revenues in the corresponding platform sectors.

City Transit share of GDP in 2013 Percent participating in transportation platforms in Jan-Oct 2018
Atlanta 1.57% .08%
Austin 1.3% .11%
Bridgeport .8% .22%
Chicago 1.3% .25%
Columbus .8% .05%
Denver 1.3% .14%
Detroit .54% .08%
Houston .76% .06%
Indianapolis .73% .09%
Los Angeles 1.5% .14%
Louisville .5% .06%
Miami 1.5% .17%
New Orleans 1.4% .23%
New York 1.2% .52%
Oklahoma City .7% .05%
Portland .86% .16%
Salt Lake City .72% .98%
San Diego 1.2% 1.2%
San Francisco 1.8% 1.5%
Seattle .92% .13%


City Accommodation share of GDP in 2013 Average monthly revenue in leasing platforms in Jan-Oct 2018
Boise City .13% .34%
Bridgeport .13% .39%
Dallas .07% .49%
Detroit .06% .93%
Houston .1% .32%
Indianapolis .09% .43%
Los Angeles .17% .54%
Madison .11% .44%
Miami .16% 1.5%
New Orleans .33% 1.8%
New York .18% .82%
Phoenix .13% 1.2%
Salt Lake City .2% .55%
San Diego .24% .91%
San Francisco .22% .67%
San Jose .16% .27%
Seattle .21% .58% 
01

In almost every metro area, average monthly revenue declined for drivers and rose for lessors between 2013 and 2018, fully accounting for the secular trends in driver and lessor revenues, even as participation shares shifted across metro areas.

Bar graph1 describes about Change in average monthly revenues on transportation platforms from Jan-Oct 2013 to Jan-Oct 2018 and Bar graph2 describes about Change in average monthly revenues on leasing platforms from Jan-Oct 2013 to Jan-Oct 2018

Finding Three

In almost every metro area, average monthly revenue declined for drivers and rose for lessors between 2013 and 2018, fully accounting for the secular trends in driver and lessor revenues, even as participation shares shifted across metro areas.

City Change in average monthly revenues on transportation platforms from Jan-Oct 2013 to Jan-Oct 2018
Bridgeport, CT -87%
Dallas, TX -79%
New York, NY -36%
Atlanta, GA -80%
Seattle, WA -43%
San Francisco, CA -27%
Everywhere else -74%
Denver, CO -58%
San Diego, CA -62%
Las Vegas, NV -60%
San Jose, CA -35%
Miami, FL -71%
Los Angeles, CA -54%
Phoenix, AZ -69%
Chicago, IL -23%
Detroit, MI -43%
Indianapolis, IN -43%
Columbus, OH -44%
Houston, TX -45%
Portland, OR -21%
Austin, TX -6%


City Change in average monthly revenues on leasing platforms from Jan-Oct 2013 to Jan-Oct 2018
San Jose, CA +6%
Austin, TX +11%
Bridgeport, CT +76%
New Orleans, LA +69%
New York, NY +59%
San Francisco, CA -+105%
Salt Lake City, UT +36%
San Diego, CA +141%
Los Angeles, CA +143%
Denver, CO +98%
Madison, AZ +216%
Seattle, WA +235%
Seattle, WA +235%
Houston, TX +160%
Portland, OR +193%
Chicago, IL +174%
Everywhere Else +200%
Miami, FL +177%
Boise, ID +215%
Louisville, KY +206%
Atlanta, GA +238%
Dallas, TX +248%
Las Vegas, NV +366%
Detroit, MI +403%
Oklahoma, OK +280%
Indianapolis, IN +292%
Columbus, OH +381%
Charleston, WV +872%
01

In both sectors but especially in transportation, participation tends to increase the most in the months and places where average revenues are increasing the most.

Line graph describes about Within-city change in average revenues from one month to the next

Finding Four

In both sectors but especially in transportation, participation tends to increase the most in the months and places where average revenues are increasing the most.

Scatter plot showing within-city change in average revenues and participation rates from one month to the next


01

At least 45 percent–and likely more–of the decline in average monthly driver revenues was accounted for by drivers participating more occasionally within the month. In the leasing sector, more frequent participation accounted for more than half of the rise in revenues.

Line graph describes about Percent of monthly participants receiving a platform paycheck in a week

Finding Five

At least 45 percent–and likely more–of the decline in average monthly driver revenues was accounted for by drivers participating more occasionally within the month. In the leasing sector, more frequent participation accounted for more than half of the rise in revenues.

Date Percent change of monthly leasing participants receiving a platform paycheck in a week Percent change of monthly transporation participants receiving a platform paycheck in a week
Jan '13 29% 76%
Apr '13 36% 77%
Jul '13 37% 67%
Oct '13 51% 78%
Jan '14 41% 75%
Apr '14 50% 78%
Jul '14 52% 73%
Oct '14 50% 70%
Jan '15 50% 75%
Apr '15 59% 74%
Jul '15 58% 73%
Oct '15 71% 58%
Jan '16 47% 70%
Apr '16 56% 73%
Jul '16 56% 69%
Oct '16 60% 71%
Jan '17 55% 67%
Apr '17 54% 71%
Jul '17 60% 64%
Oct '17 56% 63%
Jan '18 60% 59%
Apr '18 60% 54%
Jul '18 60% 60%
Oct '18 61% 61%

Data

Infographic describes about The JPMorgan Chase Institute Online Platform Economy dataset

Data

The JPMorgan Chase Institute Online Platform Economy dataset

Out of a sample of 39 million Chase checking accounts, we tracked payments directed through 128 online platforms to 2.3 million families participating in the Online Platform Economy between October 2012 and October 2018.

The 128 platforms met the following criteria:

  • Connect independent suppliers to customers
  • Mediate the flow of payment from customer to supplier
  • Empower participants to enter and leave the market whenever they want

We defined four distinct sectors in the Online Platform Economy:

    Labor Platforms

  • Transportation: drivers transporting people or goods
  • Non-transport work: workers offering services such as dog walking, home repair or telemedicine
  • Capital Platforms

  • Selling: independent sellers of goods through online marketplaces
  • Leasing: lessors of assets such as homes or parking spaces

Conclusion

Since 2013, the transportation and leasing sectors of the Online Platform Economy have grown significantly in terms of supply-side participation rates and total revenues paid to suppliers. Our results suggest that there is still room for supply-side growth in both the transportation and leasing sectors of the Online Platform Economy. Furthermore, our results raise questions about the potential effectiveness of policies to cap participation in an effort to improve revenue prospects for participants in the Online Platform Economy. As occasional engagement becomes more common in the transportation sector, important policy questions arise around what should be or can be done for would-be full-time drivers. In metro areas with large potential markets for transportation and leasing services, these sectors of the Online Platform Economy are robust alternatives for families looking to generate income, though the opportunities they present are almost certainly changing as the Online Platform Economy matures. 

Authors

Amar Hamoudi

Amar Hamoudi

JPMC Institute

Diana Farrell

Diana Farrell

Founding and Former President & CEO

Fiona Greig

Fiona Greig

Former Co-President