
Owner race by small business segment

Creating thriving communities together
See how our clients and partners—from small business owners to workforce training leaders—work with JPMorganChase to drive meaningful impact and economic growth where they live and work.
Learn moreLatest news

Veteran’s Unconventional Path to Landing her Dream Job in Tech
U.S. Army Veteran Ashley Wigfall transitioned to a civilian role and charted her path to technologist through mentorship and skills training at the JPMorgan Chase tech hub in Plano, Texas.
Learn more
Findings
The contributions of the small businesses sector to the U.S. economy are often noted in periods of economic growth, and the fragility of the sector is a core focus of policy in an economic downturn. Black-owned businesses and Hispanic-owned businesses comprise a substantial and growing share of the sector, and understanding racial gaps in small business outcomes is an important part of formulating policies. It’s also critical to understanding the extent to which the sector can deliver broad-based growth during an expansion, or where to focus policy attention and resources during a downturn, yet little recent data exists on differences in financial performance and small business survival by owner race.
This report attempts to fill this gap by leveraging voter registration data from Florida, Georgia, and Louisiana to create a sample of nearly 150,000 small businesses with self-identified owner race. We use this new data asset to inform differences in small business financial outcomes – revenues, profit margins, and cash liquidity – and small business survival by owner race from 2013 to 2019.
Our findings suggest that Black-owned businesses and Hispanic-owned businesses may be disproportionally affected during economic downturns, such as the one resulting from the 2020 COVID-19 pandemic, though support to these businesses through liquid assets and access to markets could materially support their survival. Moreover, while these findings highlight racial gaps in small business outcomes and suggest that opportunity for the sector to deliver substantial wealth creation to Black and Hispanic families may be limited, policies that target smaller small businesses, businesses with younger owners, and businesses owned by women may best support broad-based growth during a recovery.
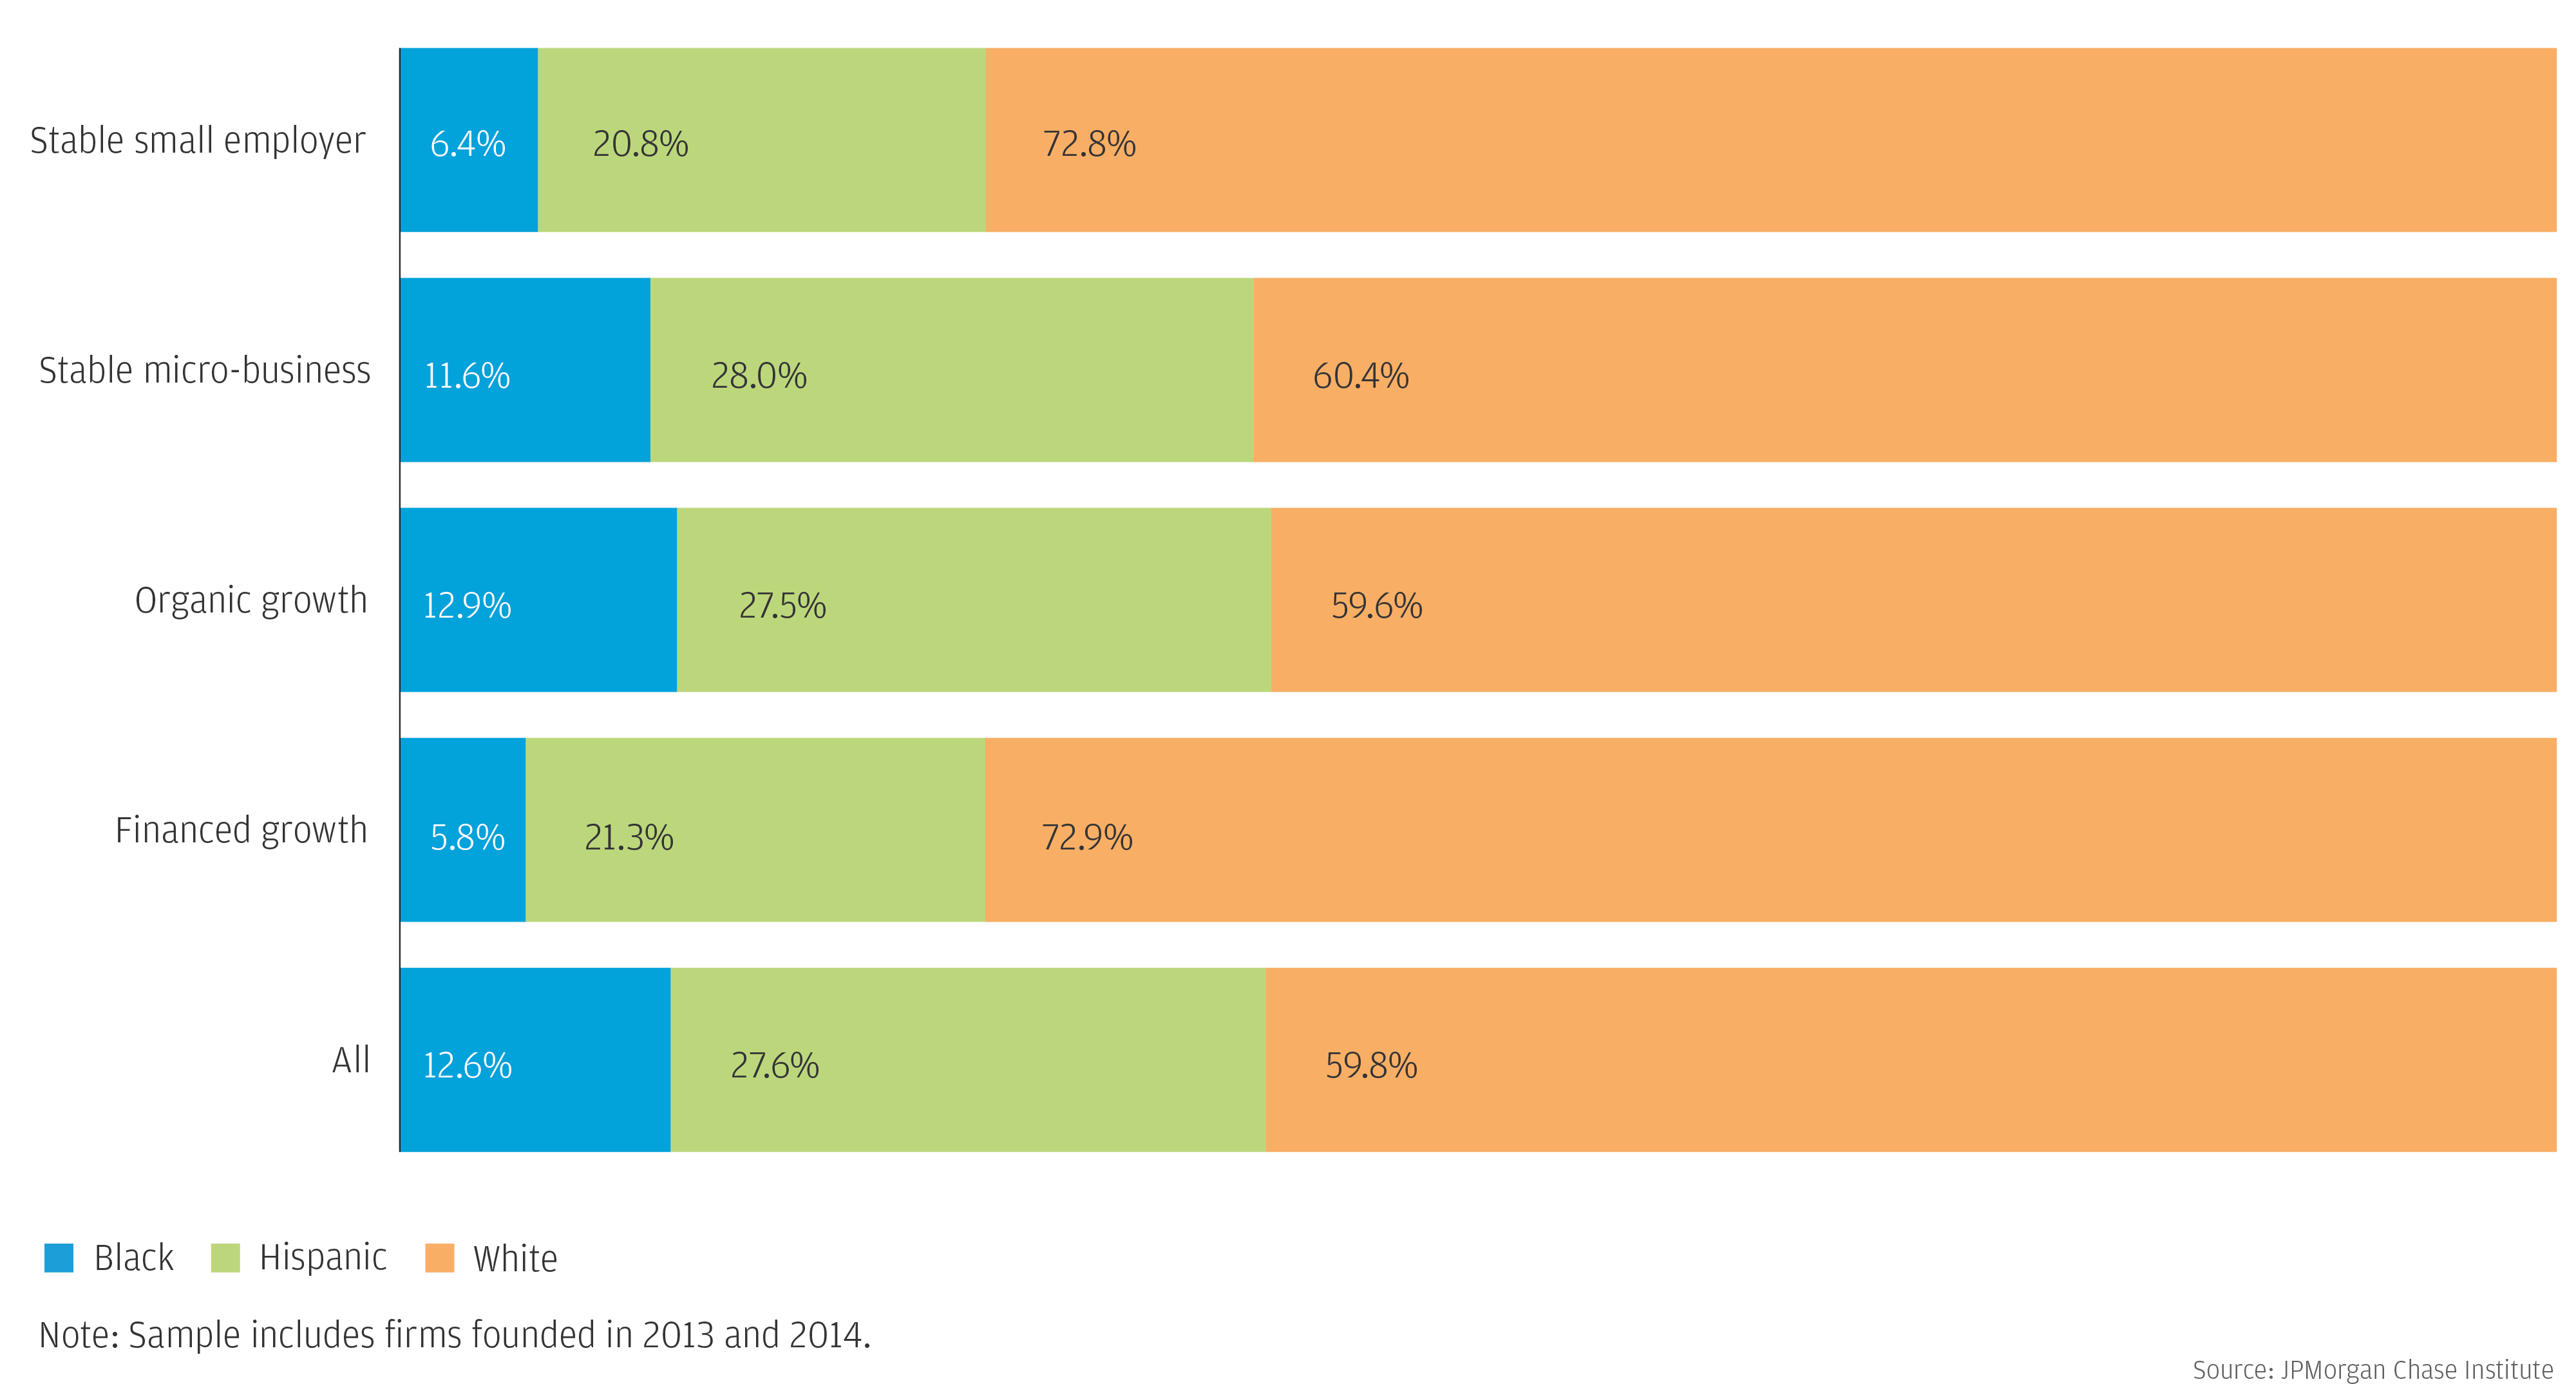
Owner race by small business segment
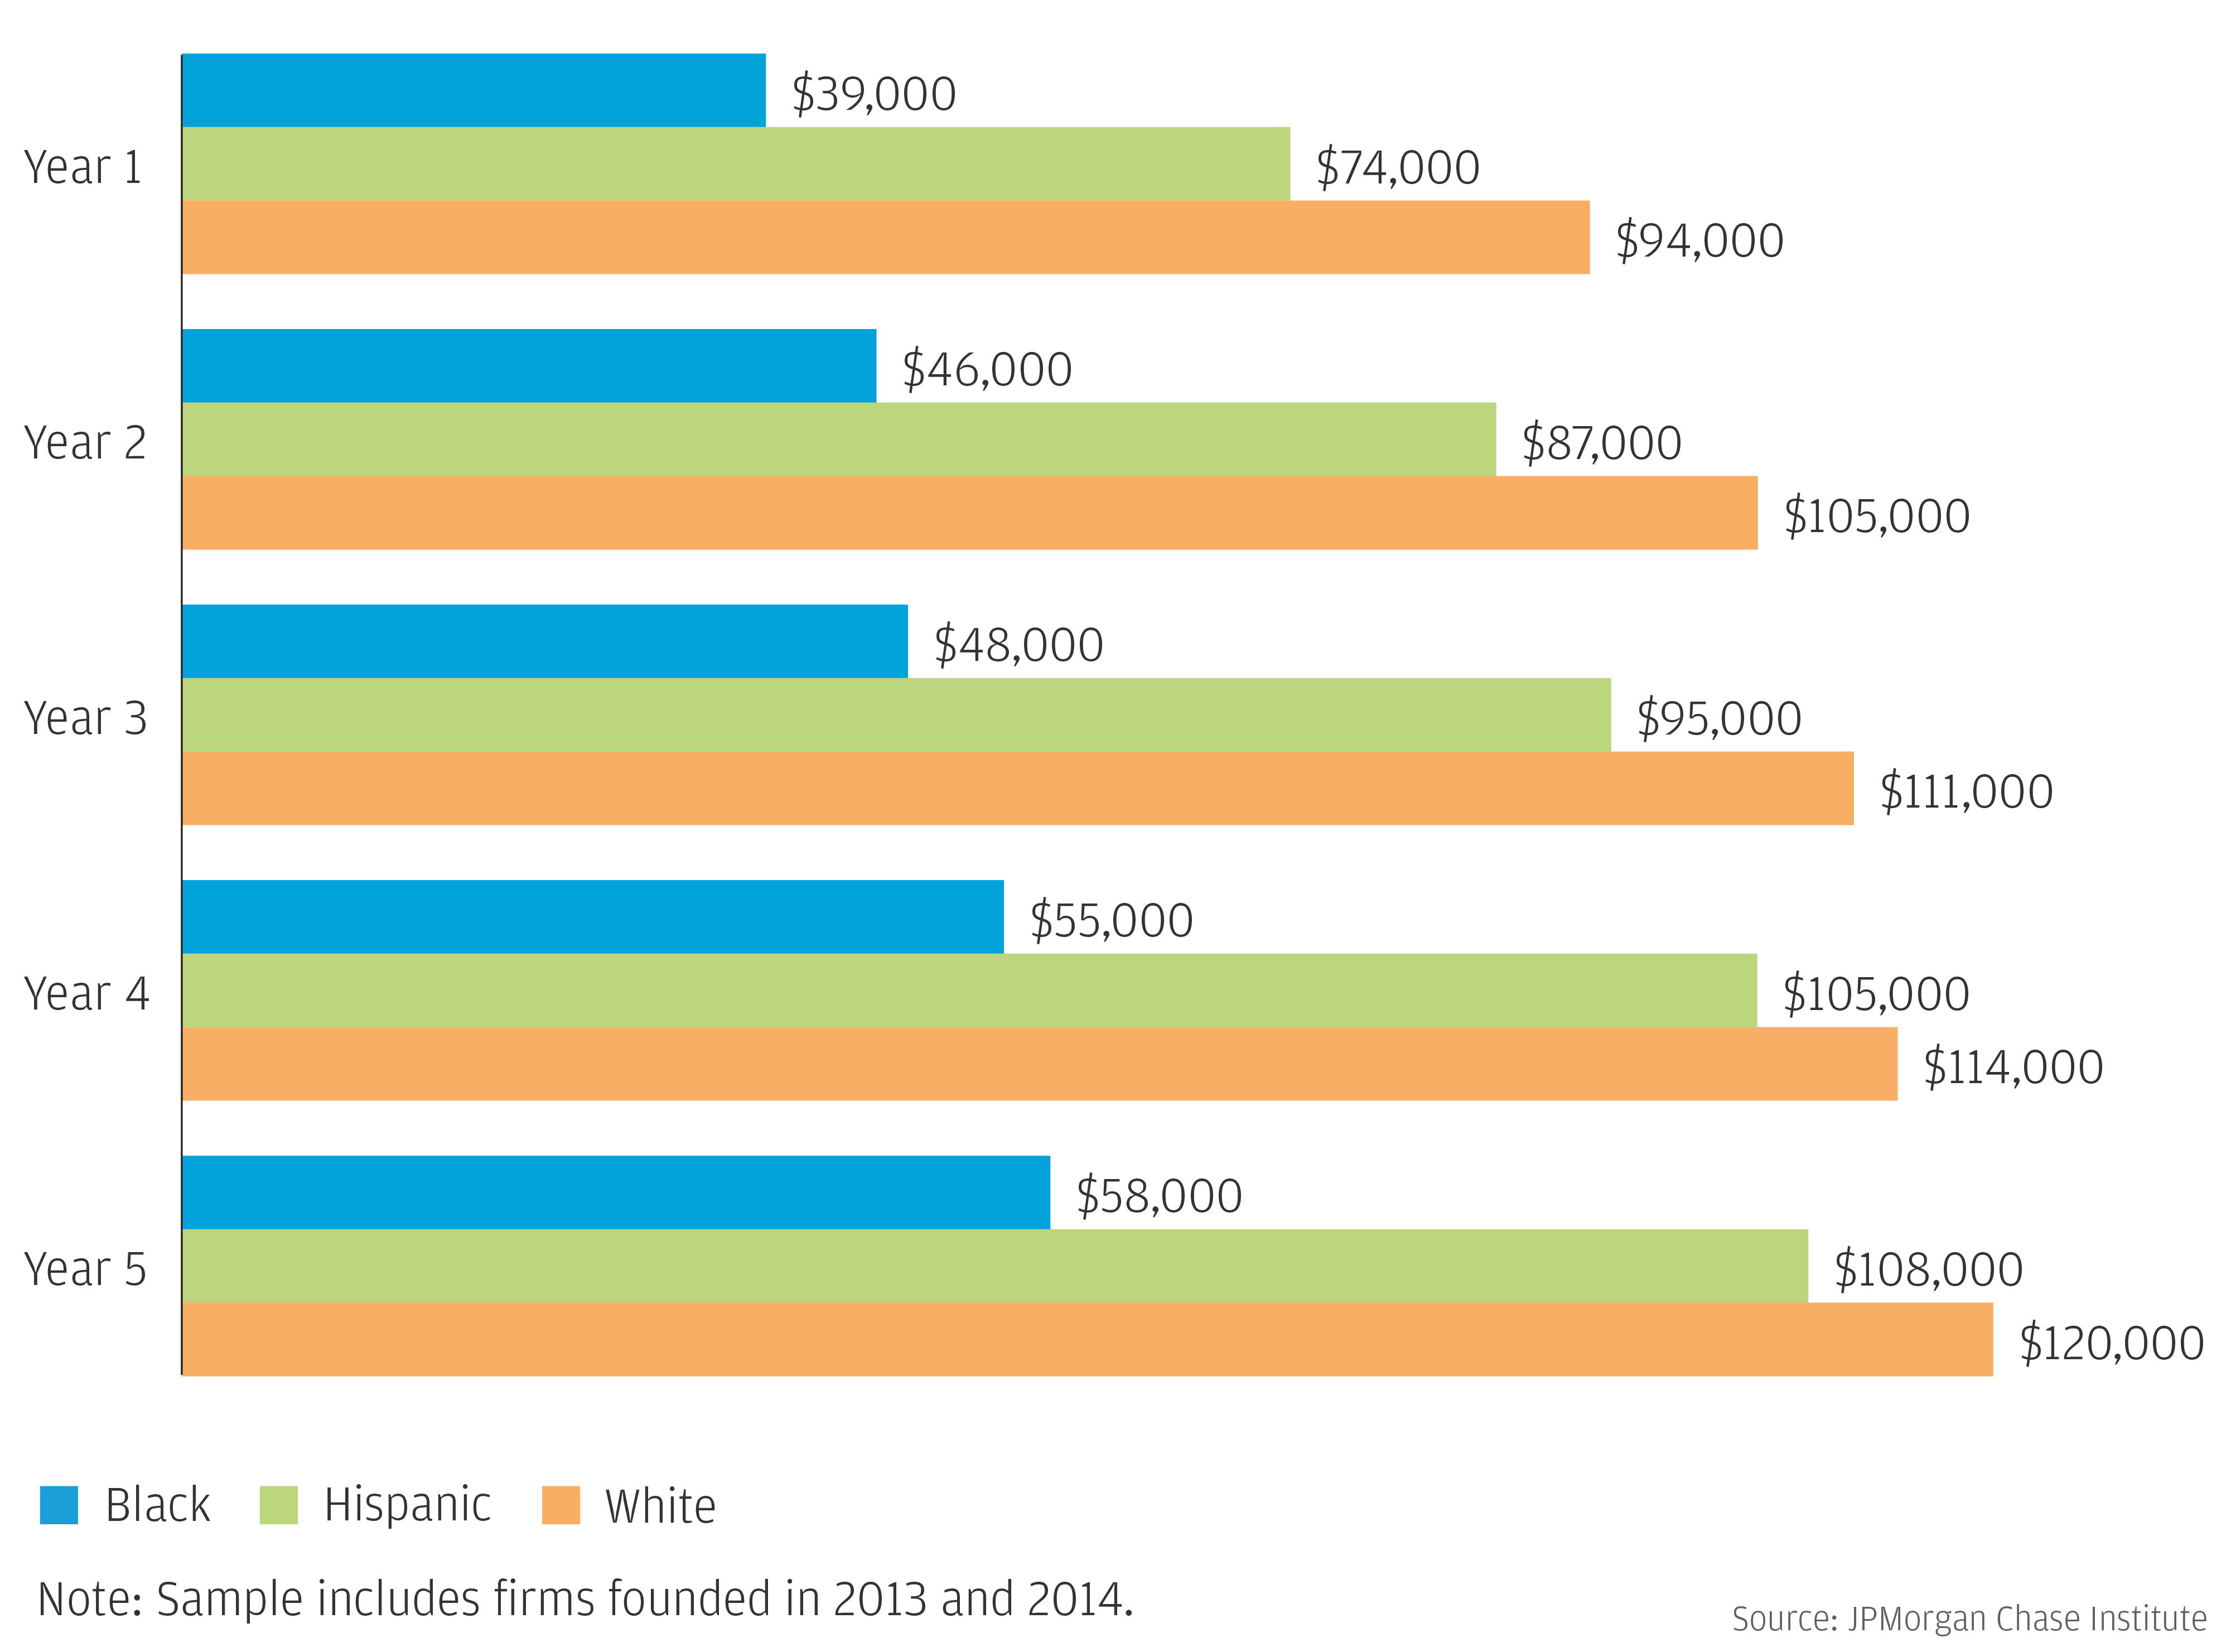
Black- and Hispanic-owned businesses face challenges of lower revenues, profit margins, and cash liquidity.
Median revenues for small businesses in the 2013-2014 cohort, by owner race
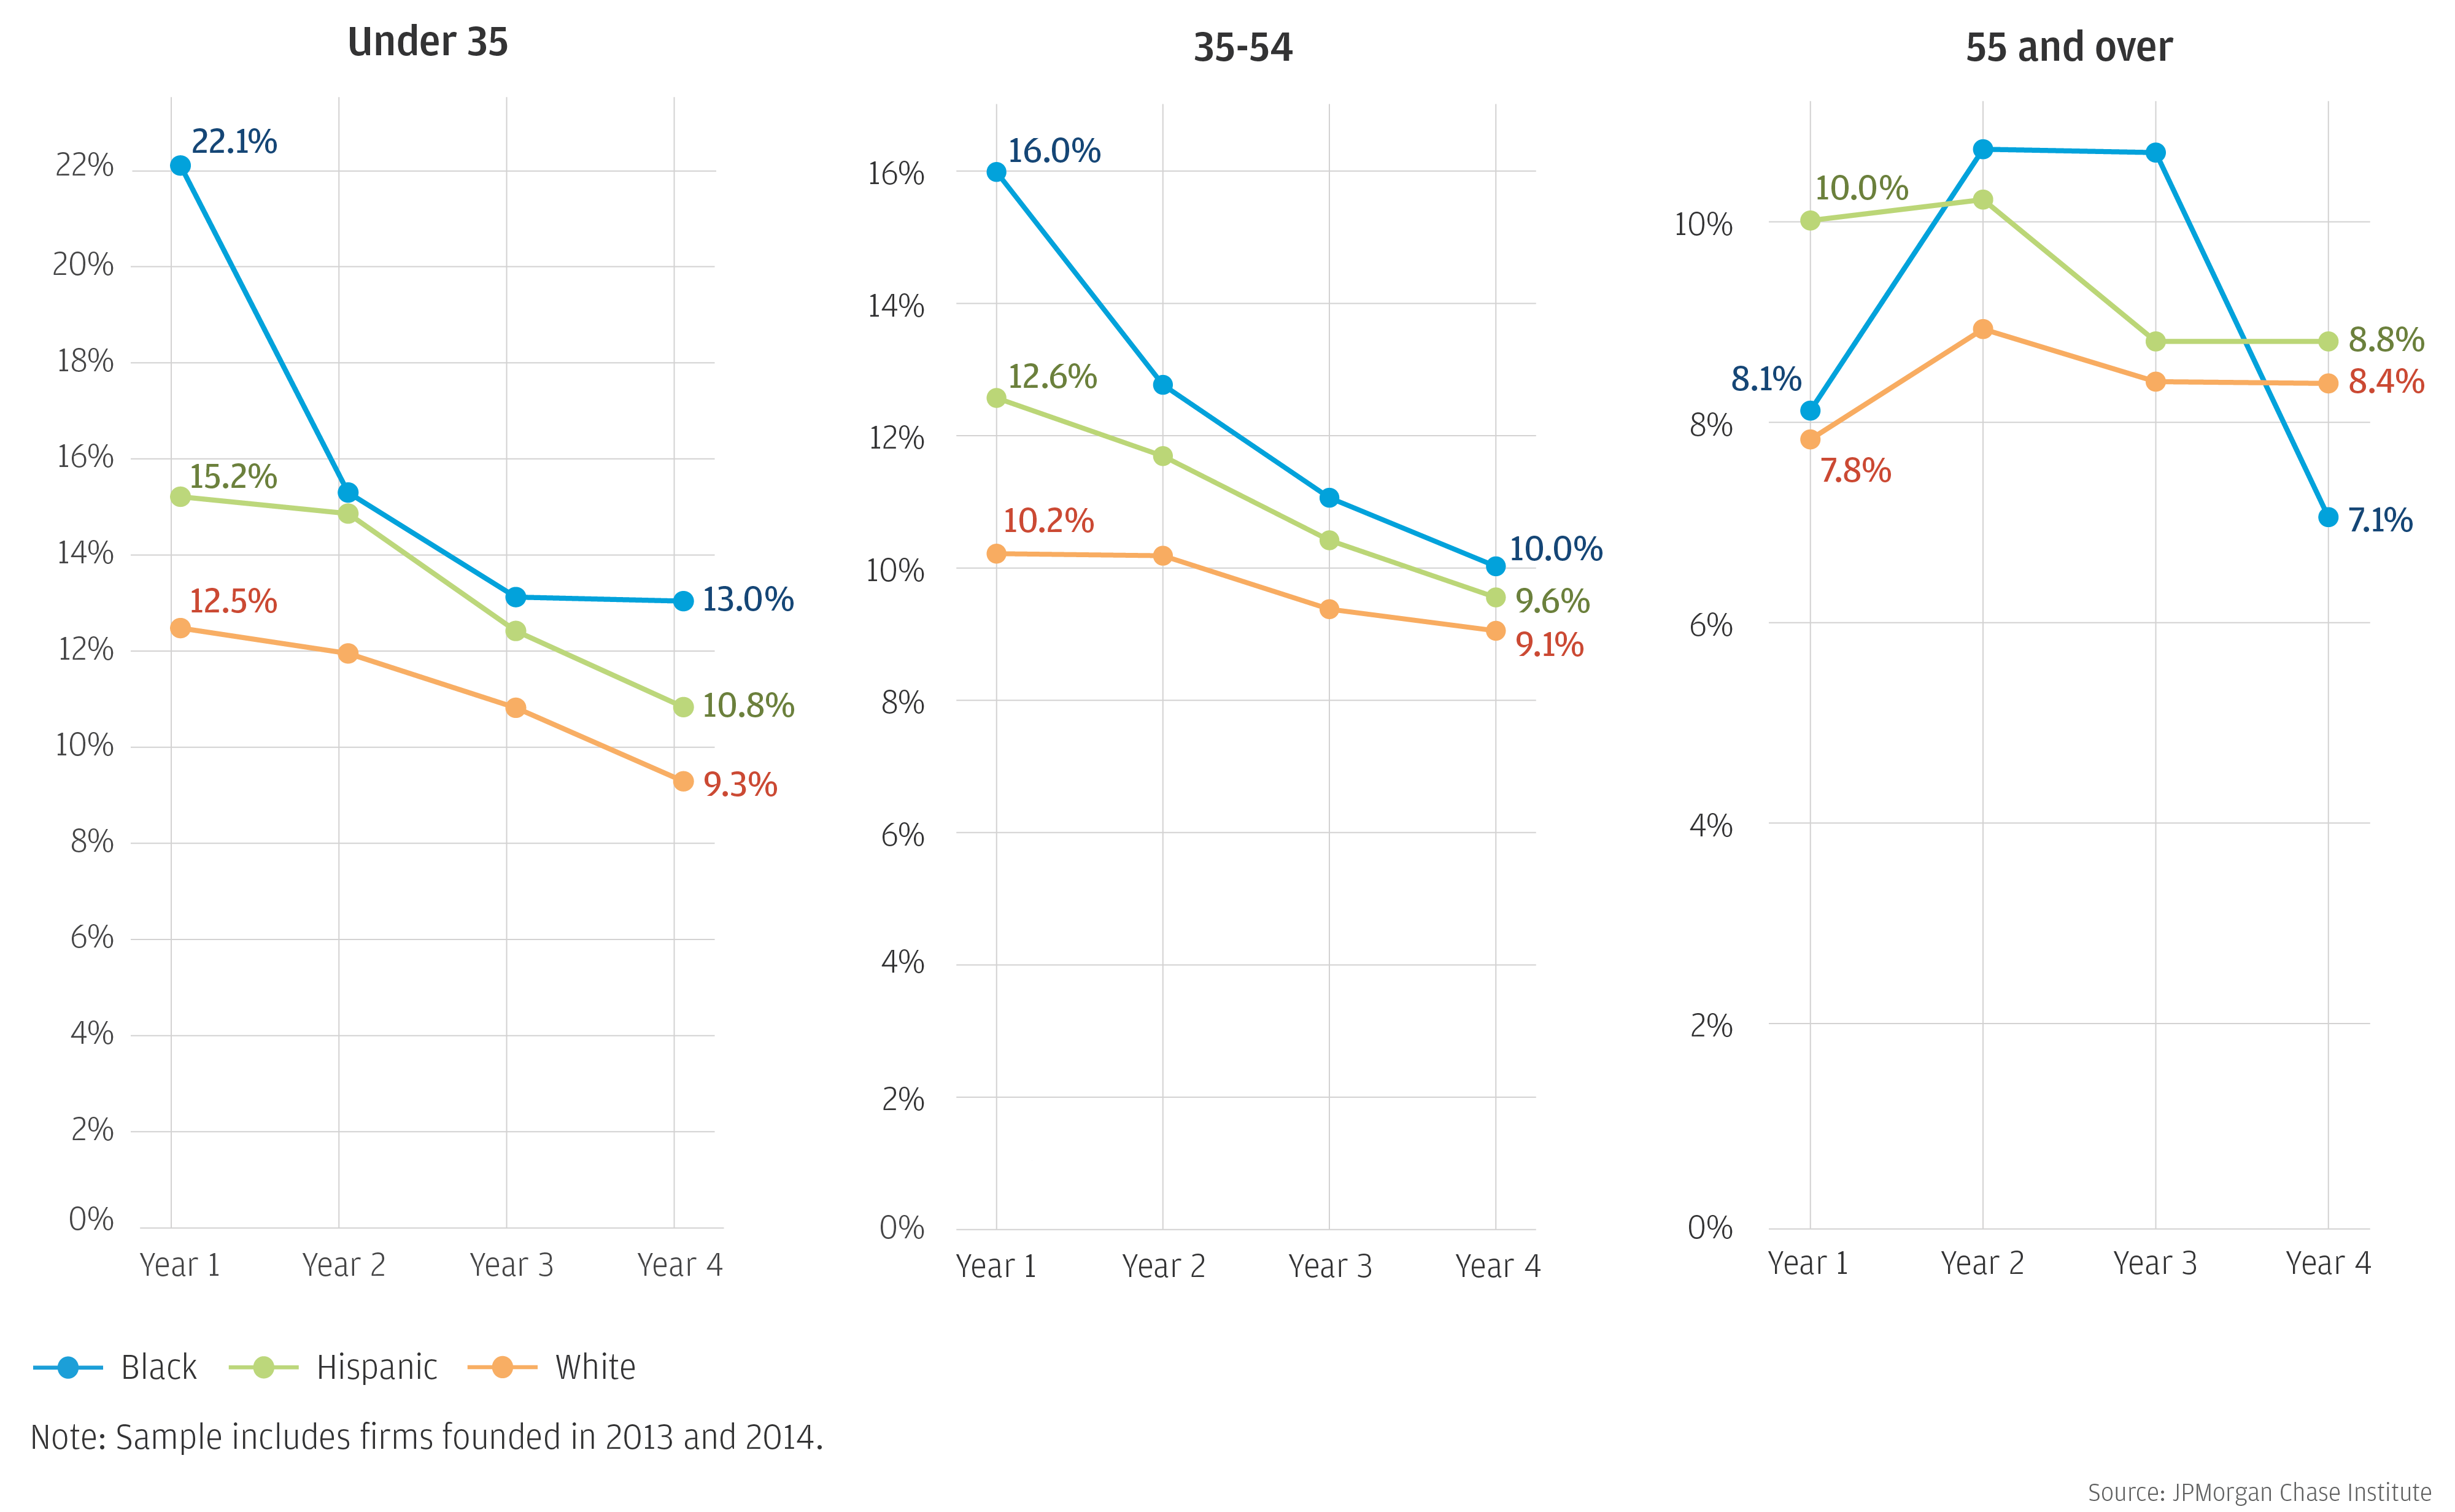
Firms with Black owners, particularly owners under the age of 35, were the most likely to exit in the first three years.
Share of firms exiting in the following year, by owner race and age group
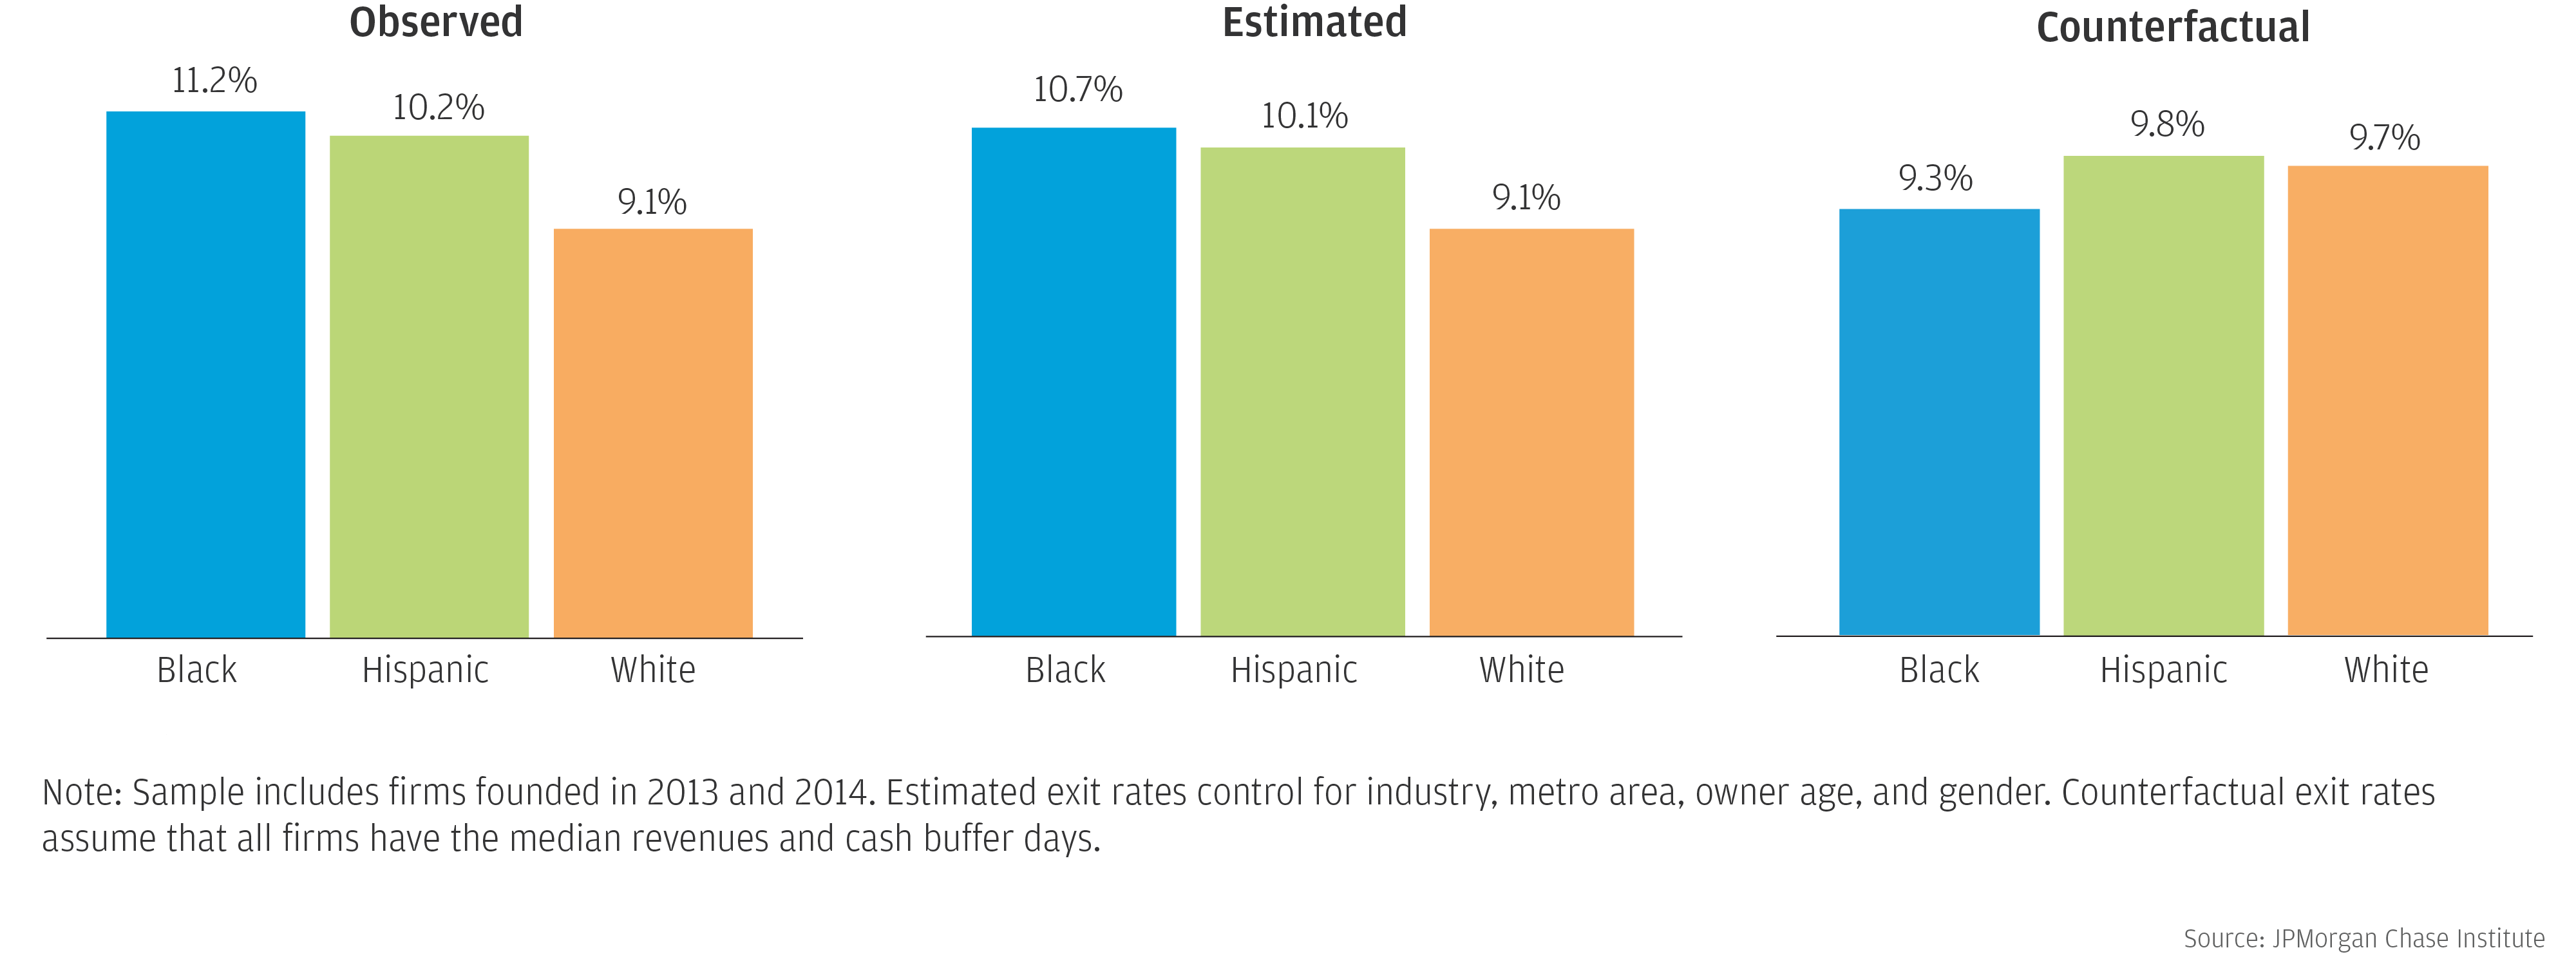
Black- and Hispanic-owned businesses with comparable revenues and cash reserves are just as likely to survive as White-owned businesses.
Shares of firms in year 3 exiting in the following year
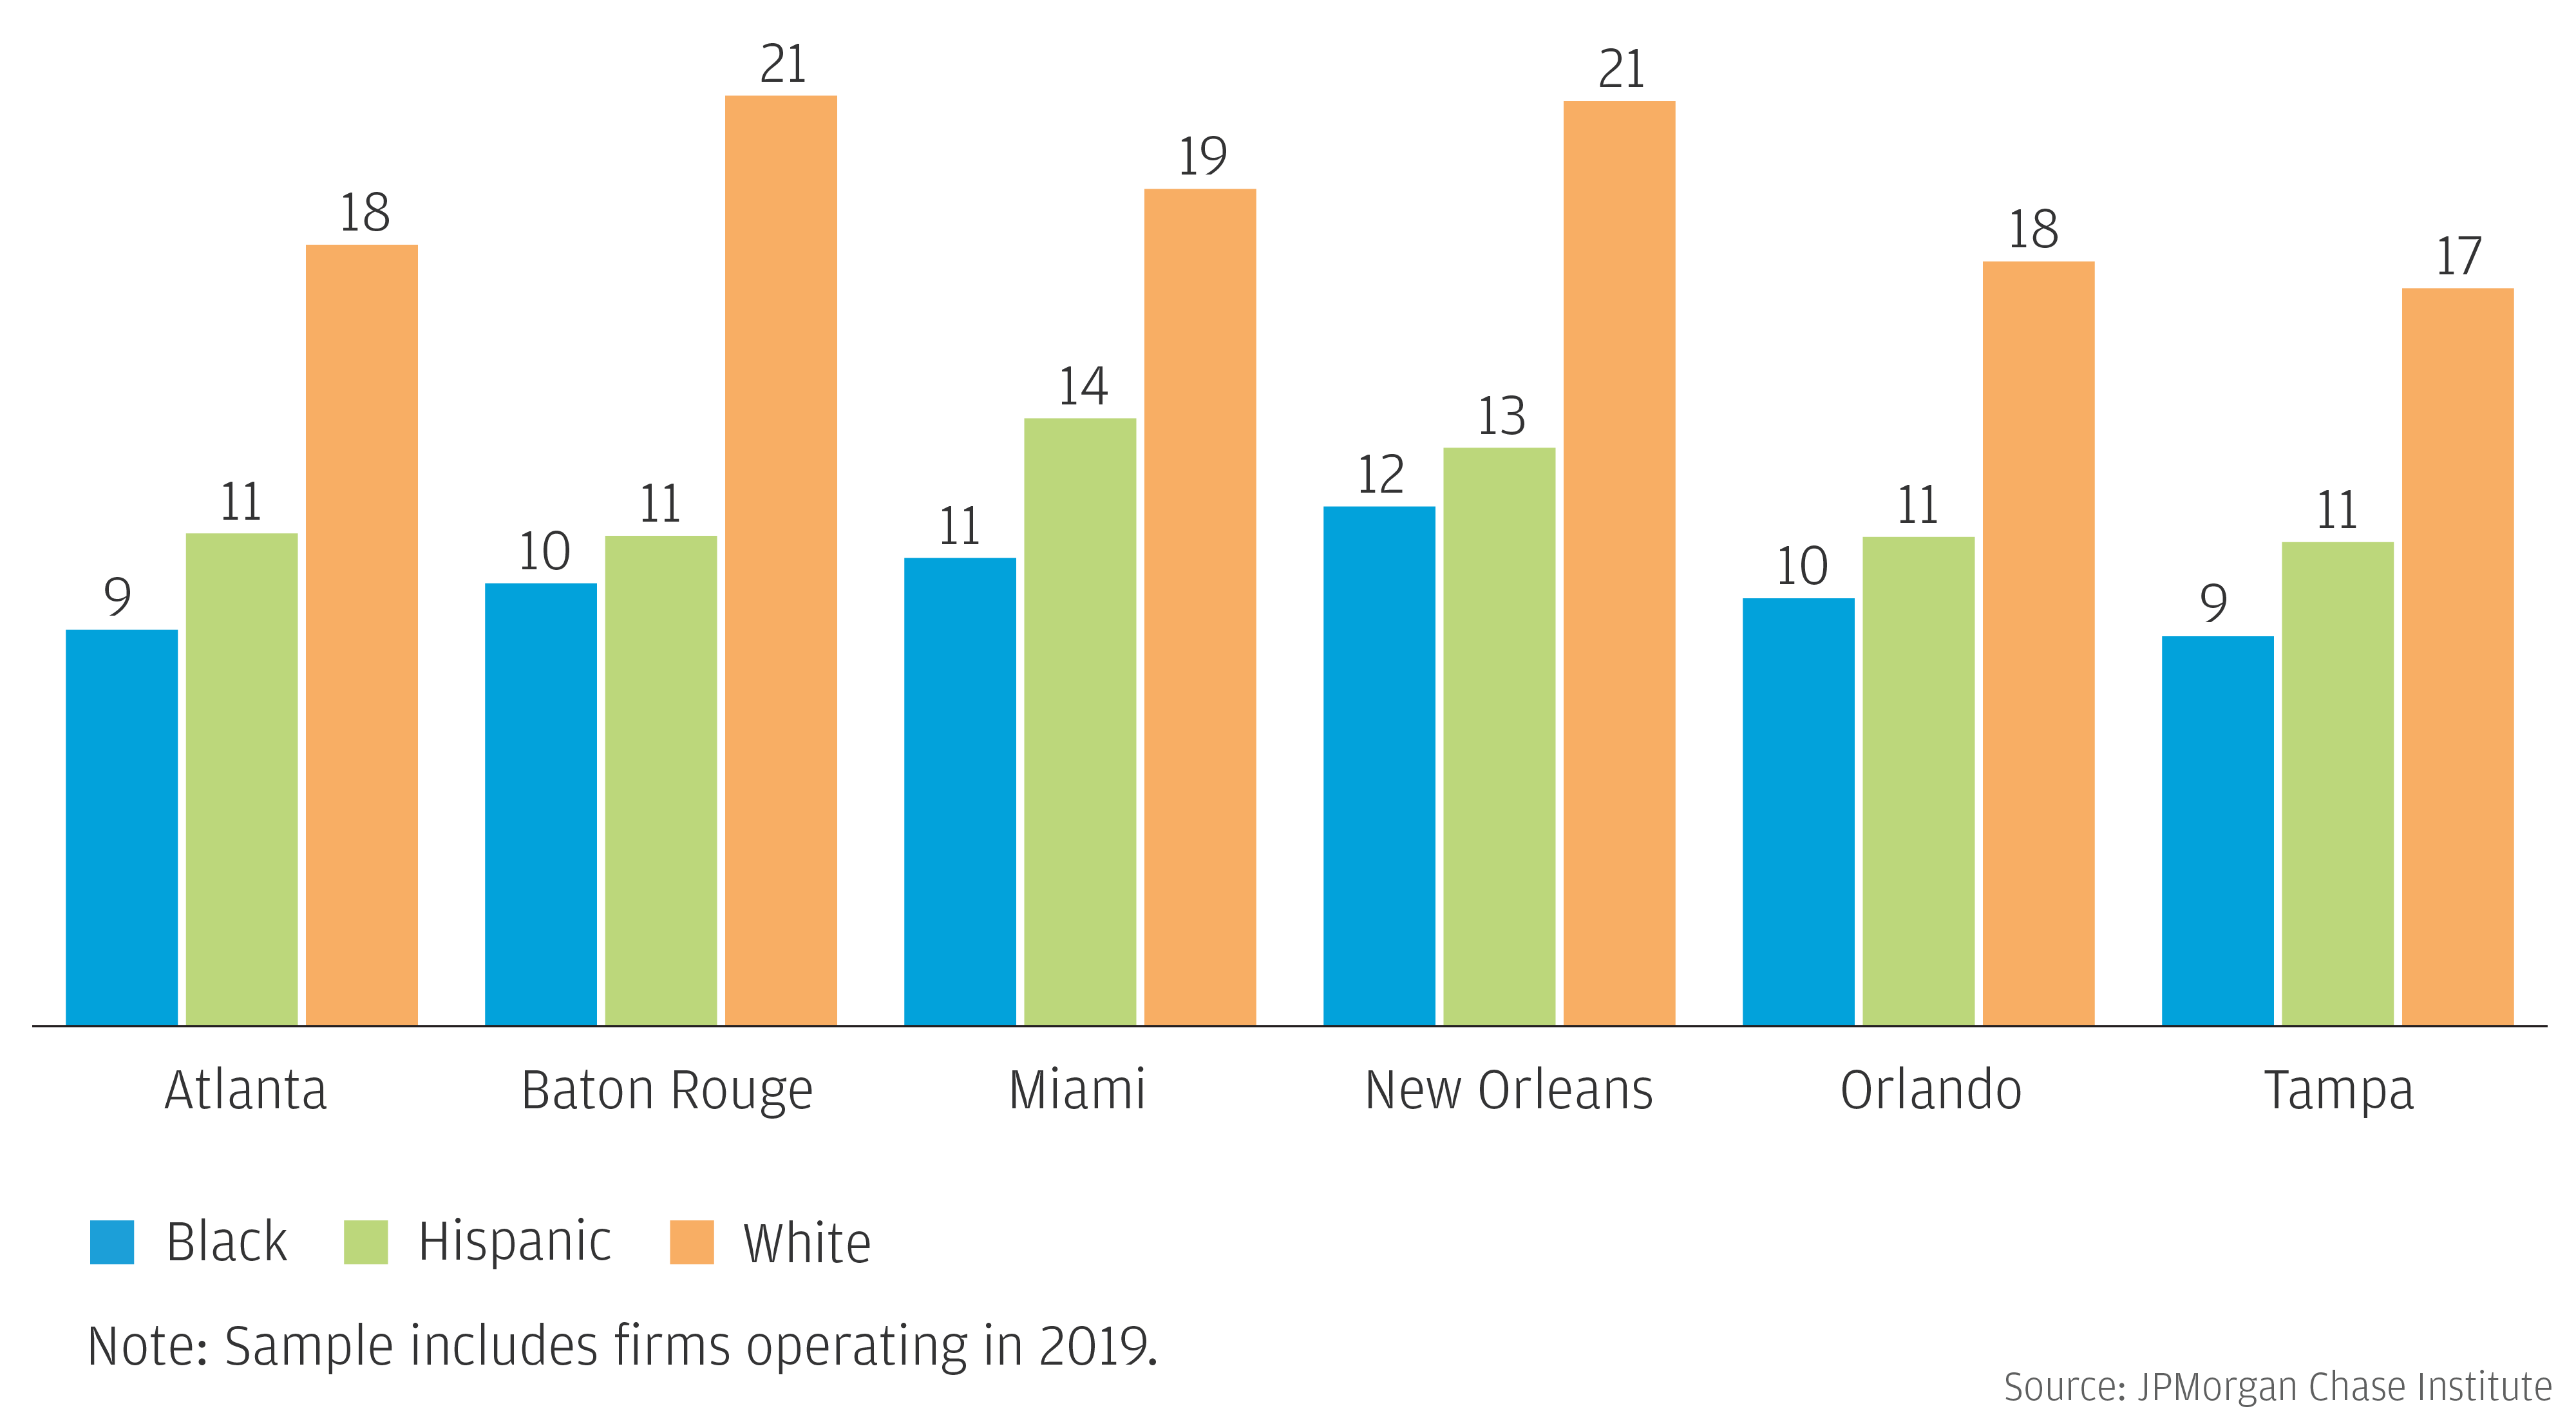
Racial gaps in small business outcomes are evident across cities, even in cities with large Black or Hispanic populations.
Median cash buffer days of small businesses in 2019, by owner race
Authors

Chi Mac
Business Research Director

Chris Wheat
President, JPMorganChase Institute

Diana Farrell
Founding and Former President & CEO