We no longer support this browser. Using a supported browser will provide a better experience.
Please update your browser.
Introduction
Pandemic-driven disruptions to family finances and behaviors, as well as to the broader economy, raise many questions about the state of healthcare spending and its impacts on families. Large decreases and often slow rebounds in household spending have been well documented during the pandemic (Greig 2021; Wheat 2021). Healthcare services were among the categories of spending that dropped the most during the early part of the pandemic (Ganong et al., 2020), suggesting COVID-related deferrals of routine care and treatment. In addition, reports suggest providers and payers waived a range of out-of-pocket expenses during COVID. National surveys—such as the Medical Expenditure Panel Survey and the Consumer Expenditure Survey—offer annual estimates of families’ healthcare spending trends, but no recent analysis has focused specifically on the trajectory and impacts of healthcare spending, with high-frequency data through 2021. This report aims to fill that gap.
This report updates our Healthcare Out of Pocket Spending Panel (Farrell et al., 2018) with a high-frequency, granular perspective on out-of-pocket healthcare spending through the end of 2021, including several categories of healthcare spending. We also have the ability to link healthcare spending with other financial attributes, such as cash balances and credit card balances, to understand the impacts of healthcare spending on other aspects of families’ financial lives. How did the pandemic impact healthcare spending, and has it recovered to expected levels? How did changes differ by type of healthcare, and what can we learn from these differences? What happens to a family’s finances following a large healthcare expense? And how do all of these trends differ by income and race?
Box 1: Our Sample
To assess healthcare spending, we use a data asset based on the personal Chase checking accounts of 1.6 million families, from January 2019 through December 2021. Administrative banking data provides a unique, high-frequency lens into consumer finances, with transaction-level views into income and expenditures. For the purposes of our research, the unit of analysis is the primary account holder, whom we subsequently refer to as a family. We focus on families for whom their Chase checking account is likely to be their primary checking account and provide a good window into their financial life. Specifically, we select account holders who had at least five transactions per month across their checking accounts and at least $12,000 in annual income each year. Our income metric represents all non-transfer inflows into the checking account, which includes payroll income, cash and paper checks, social security income, etc. Note that this reflects take-home income, different from gross or pre-tax measures of income reflected in most public data sources.
We assess a family’s total spending by summing checking account outflows via debit card or electronic channels, excluding debt payments and transfers, as well as credit card transactions for families who have a Chase credit card. Given our goal of assessing healthcare spending, it is important to have as complete an understanding of each family’s overall spending patterns as possible. With that in mind, we cap the amount of unknown spending—cash withdrawals, cashback transactions on debit or credit cards, and payments to non-Chase credit cards—for families in our sample. Because we cannot assess where these funds are ultimately spent, we remove families from our sample if unknown spending comprises 20 percent or more of their total spending.
For the families who meet the above criteria, we classify spending transactions to identify healthcare spending. For debit and credit card transactions, we infer the expense category based on the merchant category code; for electronic transactions, we analyze the text description associated with the transaction to infer category. Since we do not have itemized receipt-level information, everything purchased as part of the same transaction is categorized uniformly. This is an easy task for specialized merchants, such as dentists, but more difficult in cases such as drug stores, which sell many different types of goods, not all of which are related to healthcare. For this reason, we chose not to classify drug store spending as healthcare spending. Ultimately, our healthcare spending metric is comprised of five sub-categories: self-explanatory Hospital, Doctor, Dentist, and Vision categories, along with an Other category, which includes spending on chiropractors, medical devices and nursing and home health aides.
It is important to note that our healthcare spending metric measures out-of-pocket healthcare expenditures only. Dollar amounts in this report therefore represent a lower bound of families’ total healthcare spending. Our metric does not include health insurance premiums, or healthcare spending conducted directly via health savings account (HSA) debit cards, nor does it adjust for later HSA reimbursements. This is particularly important to keep in mind when comparing out-of-pocket healthcare spending across groups. If the groups in question have different levels of insurance coverage—higher deductibles, higher copays, fewer services covered free of charge—that will translate to higher healthcare spending by our measurement, even if the underlying services were the same.
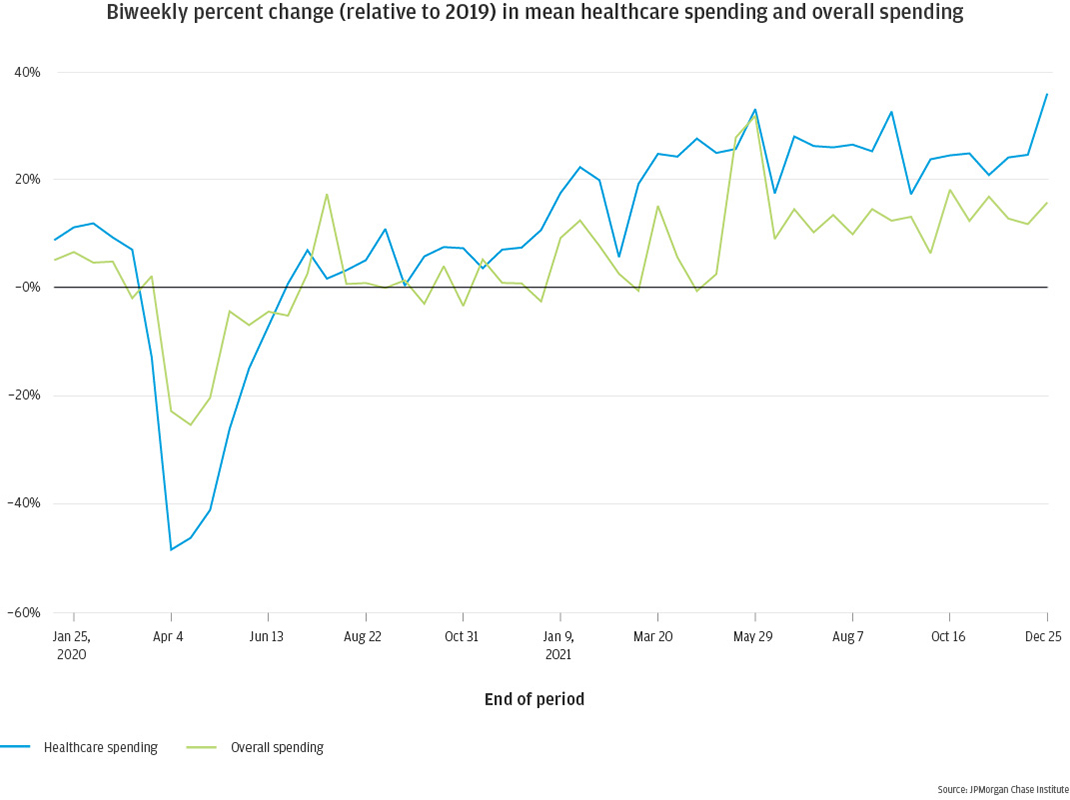
As noted above, consumer spending decreased dramatically at the start of the COVID-19 pandemic. For families in our sample, average overall spending was down 25 percent in April 2020 relative to April 2019, and did not rebound to pre-pandemic levels until early 2021 (Figure 1). Healthcare spending fared even worse, dropping by nearly 50 percent before rebounding. By spring of 2021, healthcare spending reached a new steady state, 25 to 30 percent higher than 2019. Overall consumer spending reached a new steady state in June 2021, elevated 10 to 15 percent relative to 2019.
Figure 1: On a percent-change basis, average biweekly healthcare spending decreased more during the pandemic than average overall consumer spending, but recovered beyond pre-pandemic levels during 2021 more quickly than overall spending
The greater elevation in healthcare spending relative to overall spending is likely due to many factors, two of which we will assess in greater depth in this report. First, broader economic forces differentially impacted various sectors of the economy. Spending patterns changed dramatically during COVID with increases in certain categories like groceries and home improvement, and big decreases in a variety of in-person services, including healthcare (Wheat et al. 2021). In addition, the price consumers paid for medical services increased more than the price of overall goods (6.9 percent vs. 6.0 percent between 2019 and 20211) impacting average spending on healthcare.
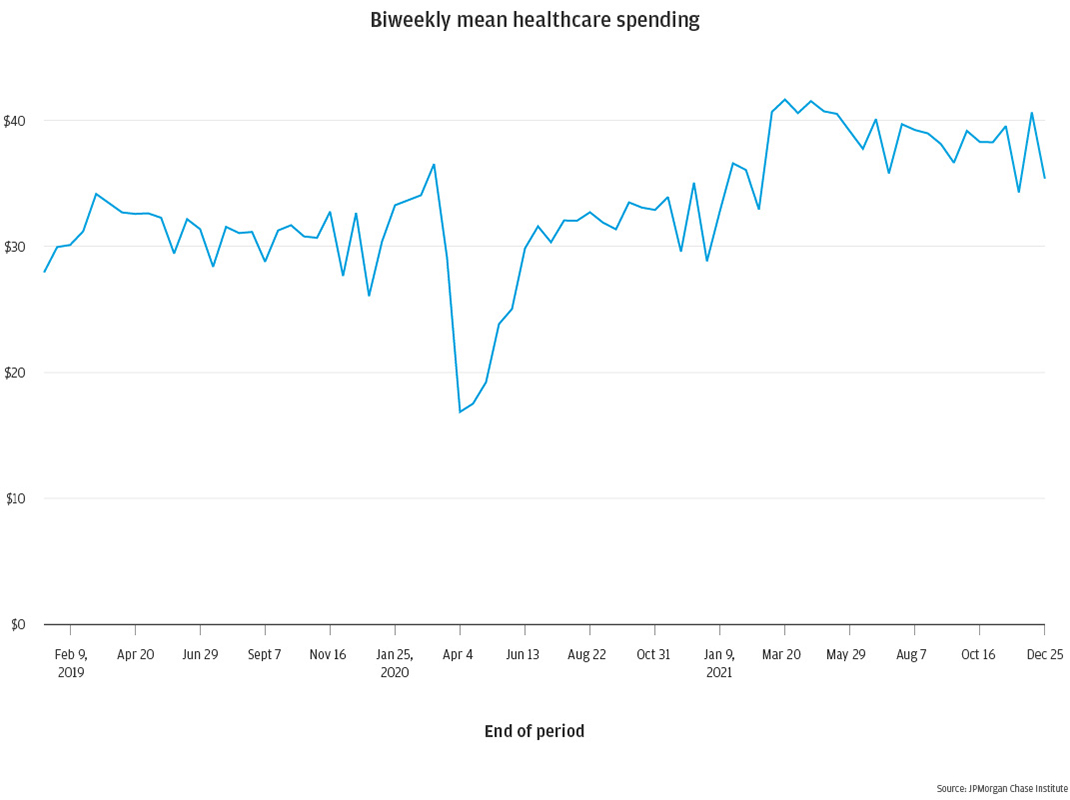
In addition to changes in inflation, healthcare spending was also impacted by deferred care during the pandemic, when families may have delayed a healthcare expense event rather than fully omitting. That could raise their 2021 healthcare spending amounts relative to previous years, as families played catch-up as the pandemic waned. Indeed, in Figure 2 we see reduced healthcare spending early in the pandemic, rebounding to 2019 levels by mid-2020, ramping up to a notably higher new normal by March 2021.
Figure 2: Healthcare spending declined sharply early in the pandemic, rebounding by mid-2020 and increasing above pre-pandemic levels during 2021
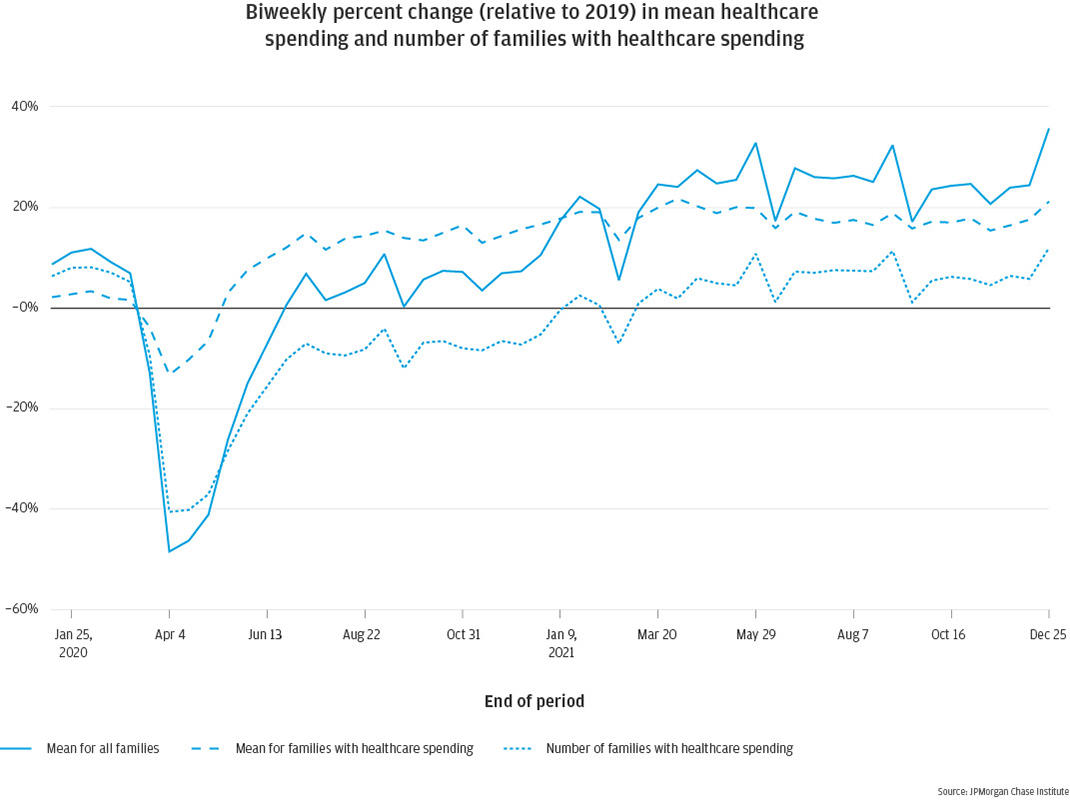
To understand the drivers of these changes, we decompose average healthcare spending to understand the impact from each of its components: how many families engage in healthcare spending at each point in time, and how much does each family spend? In other words, how much is the average impacted by fewer people spending versus lower per-visit spending for the families who seek healthcare services?
The initial decrease in average healthcare spending at the start of the pandemic was driven primarily by a decrease in the number of families spending on healthcare, down 40 percent in April 2020. There was also a smaller but still notable decrease in the average dollar spent per family with healthcare spending, which was down about 13 percent at the same time. Cost per healthcare spend increased quickly to surpass pre-pandemic levels by June 2020, while the number of families spending on healthcare did not return to pre-pandemic levels until June 2021, a full year later. For the bulk of the pandemic, fewer families incurred healthcare spending, at higher rates of cost per visit, perhaps indicating that people avoided interacting with healthcare facilities for minor, lower-cost issues, such as routine procedures or check-ups. That deferral of care may continue to drive increases in healthcare spending beyond 2021, as families return to pre-pandemic behaviors.
Figure 3: Both the number of families spending on healthcare and the amount spent per event decreased on a percent basis at the onset of the pandemic, later recovering to or exceeding pre-pandemic levels by 2021
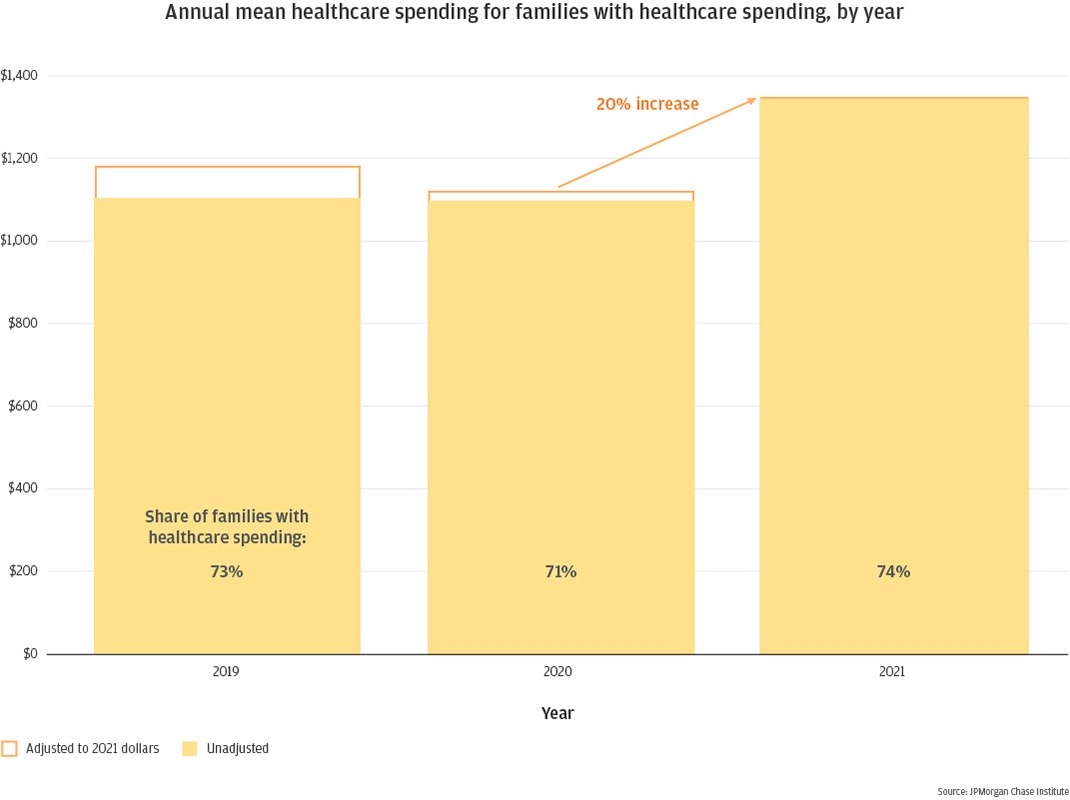
On an annual basis, conditional mean out-of-pocket spending on healthcare services decreased from 2019 to 2020 in real dollar terms, increasing again in 2021. In nominal dollars, overall healthcare spending remained flat from 2019 to 2020, increasing by 23 percent in 2021, from $1,100 per family with medical spending to $1,350 (Figure 4). The JPMorgan Chase Institute Healthcare Out-of-Pocket Spending Panel previously demonstrated annual growth2 in healthcare spending (Farrell and Greig, 2018). With this growth trajectory in mind, flat healthcare spending between 2019 and 2020 represents a decrease in 2020 spending. Indeed, using Consumer Price Index (CPI) data to express the 2019 and 2020 averages in 2021 dollars, we see that 2020 decreased by 5.2 percent relative to 2019. The subsequent 20 percent increase in 2021 represents a 14 percent increase from 2019 in real dollars, or 6.8 percent per year. Families may not have fully caught up on the healthcare spending or services that they deferred during the pandemic.
Figure 4: In raw dollars, families with out-of-pocket medical expenses spent roughly the same in 2019 and 2020, though this represented a decrease when accounting for inflation; spending increased 20 percent in 2021
Note that several factors may contribute to rising annual healthcare spending. Spending might rise as families begin seeking more care, but families may also be spending more money for comparable levels of care from prior years. Pricing for healthcare services may be on the rise, and the proportion of that price that families are responsible for may also rise, due to higher deductibles and copays. Indeed, the Kaiser Family Foundation 2021 Employer Health Benefits Survey3 shows an increase in average deductible in 2021 but not in 2020. Likewise, the share of covered employees with a deductible over $2,000 also rose in 2021 (after falling slightly in 2020).
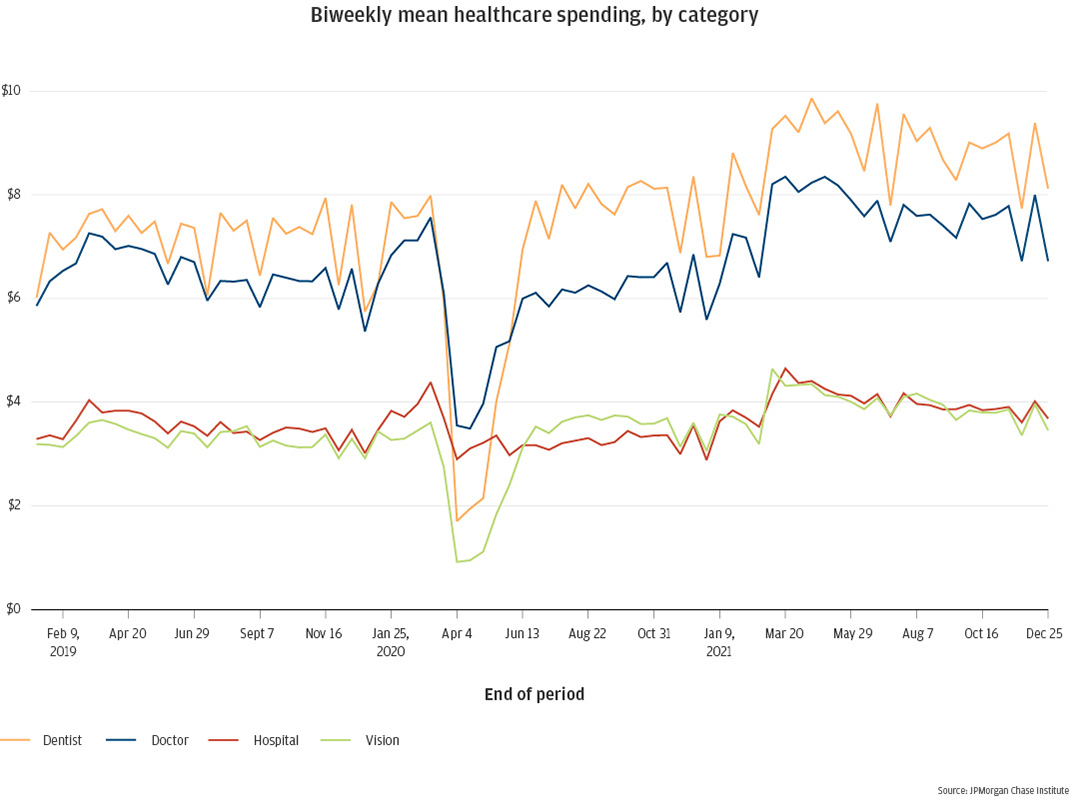
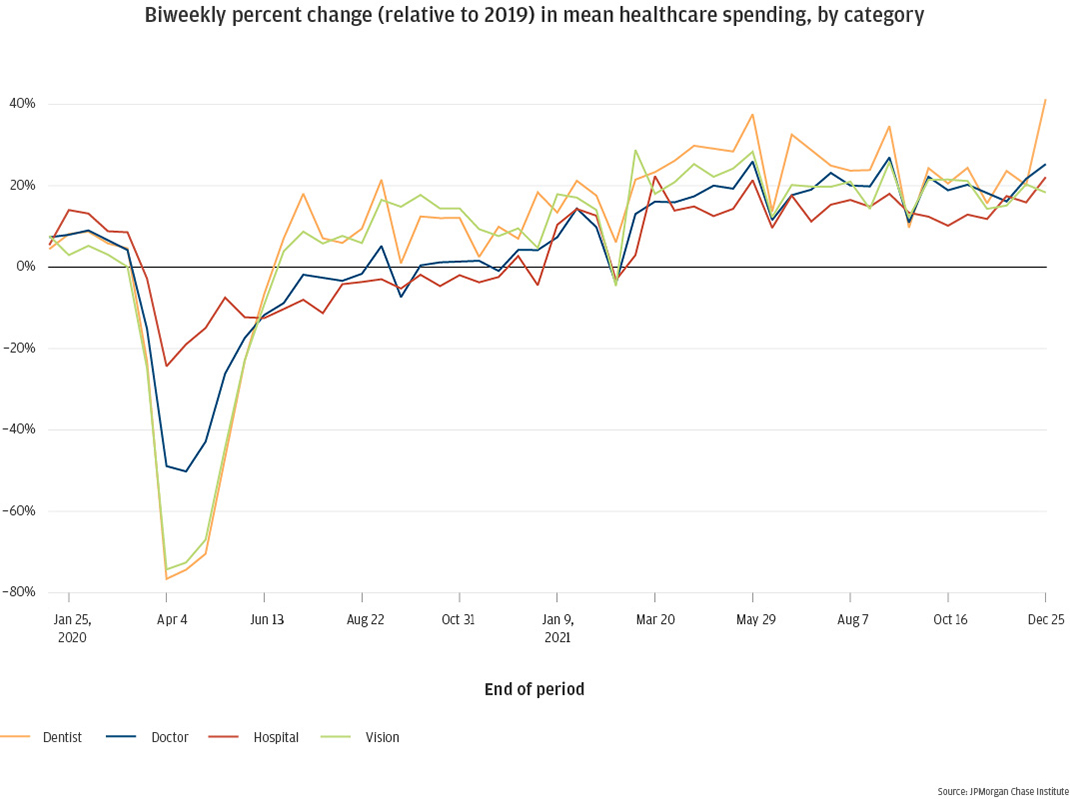
In a typical week, families spend more on dentist and doctor visits than they do on hospital or vision care (Figure 5). In aggregate, these four categories represent approximately two-thirds of overall healthcare spending shown in Figure 2. In dollar amounts, dentist and doctor spending decreased the most at the start of the pandemic, contributing the most to the decline in overall healthcare spending. To best understand spending trajectories over the last two years, we assess each category on a percent change basis. Figure 6 shows that dentist and vision categories decreased the most on a percent basis relative to 2019, both down by roughly 75 percent in late March 2020. Spending on doctors decreased less, reaching a minimum of 50 percent depressed, and hospitals changed the least, with a minimum of 24 percent depleted. Notably, recovery was swifter for the former categories, with dentist and vision surpassing pre-pandemic levels by July 2020 and remaining elevated through the end of 2021. In contrast, spending on doctors and hospitals did not reach pre-pandemic levels until January 2021 and remained only slightly above pre-pandemic levels through the end of 2021.
Figure 5: Weekly medical spending on Dentist and Doctor categories is notably higher than on Hospital and Vision, and spending in dollars decreased to a greater extent during the pandemic; all categories rebounded above pre-pandemic levels by 2021
Figure 6: On a percent basis relative to 2019, dentist and vision spending decreased the most at the start of the pandemic and recovered the fastest, with doctor and hospital spending experiencing more muted declines but slower recoveries
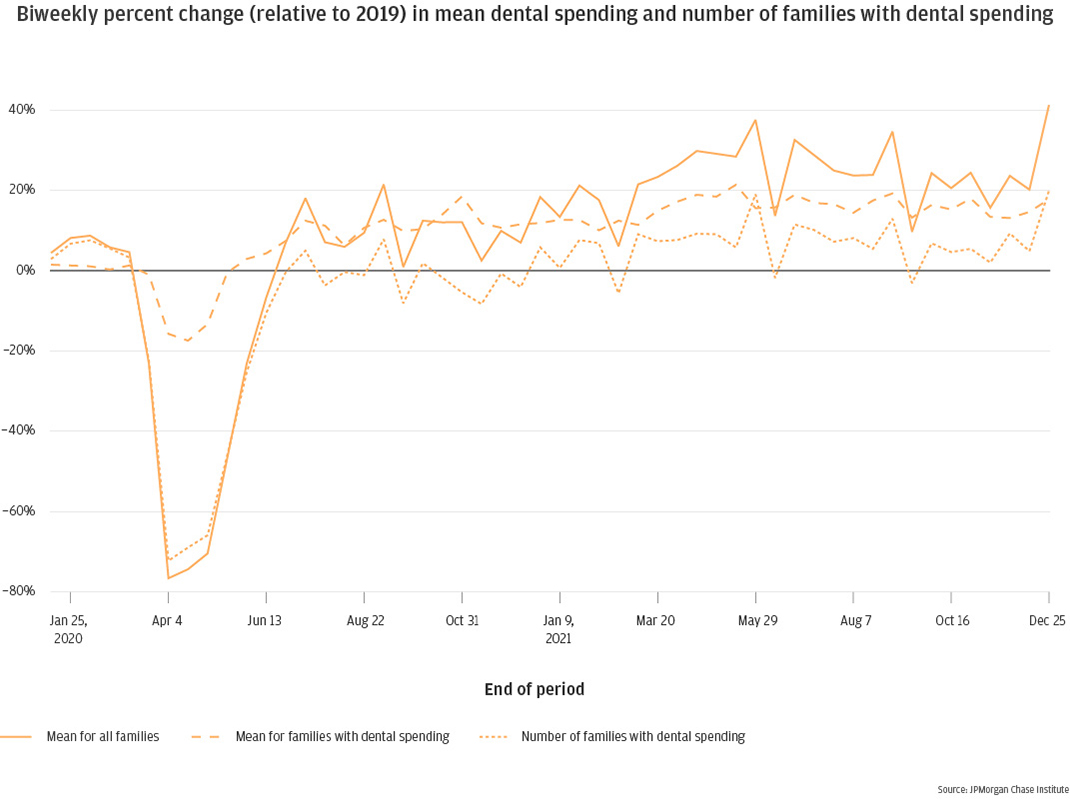
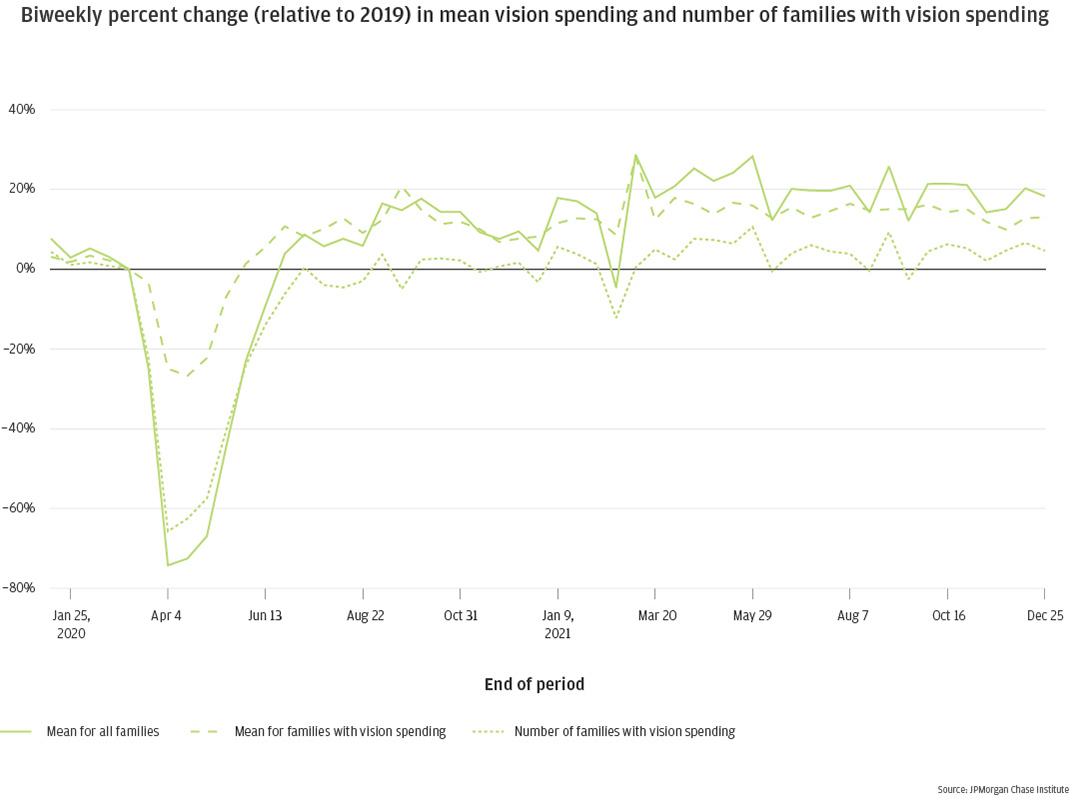
Again, decomposing changes in average spending allows us to understand the impact of changes in use of each category of healthcare service vs. changes in amount spent per service. Dentist and vision services have very similar stories: at the start of the pandemic, the number of families spending in each category was down 66 to 72 percent, and the amount spent by those families was down 17 percent for dentist and 27 percent for vision (Figures 7a & 7b). The number of families with healthcare spending in each category reached pre-pandemic parity by July 2021 and stayed steady, whereas the amount spent surpassed pre-pandemic levels over the same time period and remained elevated through the end of 2021. So, for dentist and vision spending, the initial pandemic decreases were driven mainly by fewer families spending on these services, coupled with a smaller decrease in the amount spent by those families; and the higher average spending in 2021 relative to pre-pandemic was driven entirely by larger spending per family, while the number of families spending remained steady.
Changes in spending on doctors and hospitals followed different mechanisms than changes in dentist and vision spending. The decreases in average doctor and hospital spending at the start of the pandemic was due entirely to fewer families spending in those categories (Figures 7c & 7d). Spending per family in spring 2020 showed only a negligible dip for doctor spending, and hospital spending per incident actually began to increase during that time. From May 2020 onward, the amount per family with spending in each category was elevated by roughly 17 to 23 percent for doctors and 8 to 16 percent for hospitals. However, the number of families spending in each category remained depressed throughout our study timeframe, reaching parity with 2019 around May 2021 but never quite catching up with the February 2020 baseline. This may indicate families’ continuing hesitation with exposure to healthcare facilities during the pandemic, possibly opting to skip or delay non-critical healthcare until infection rates decrease further.
Figure 7a: Dentist
Figure 7b: Vision
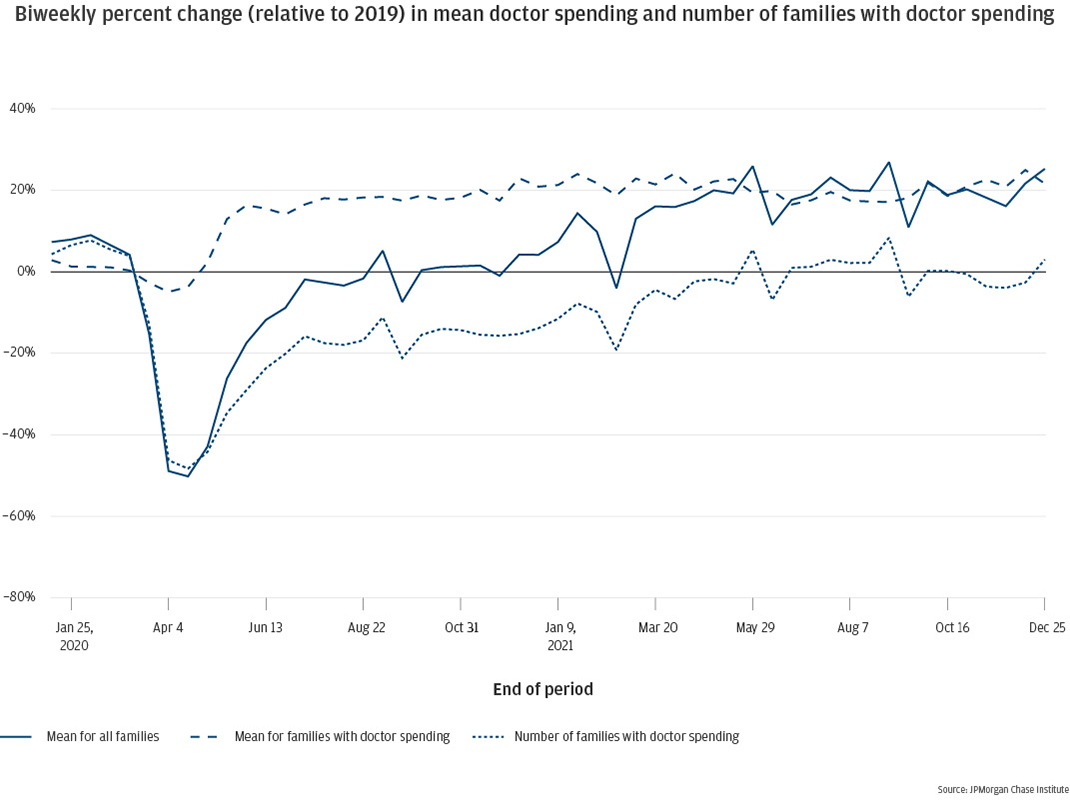
Figure 7c: Doctor
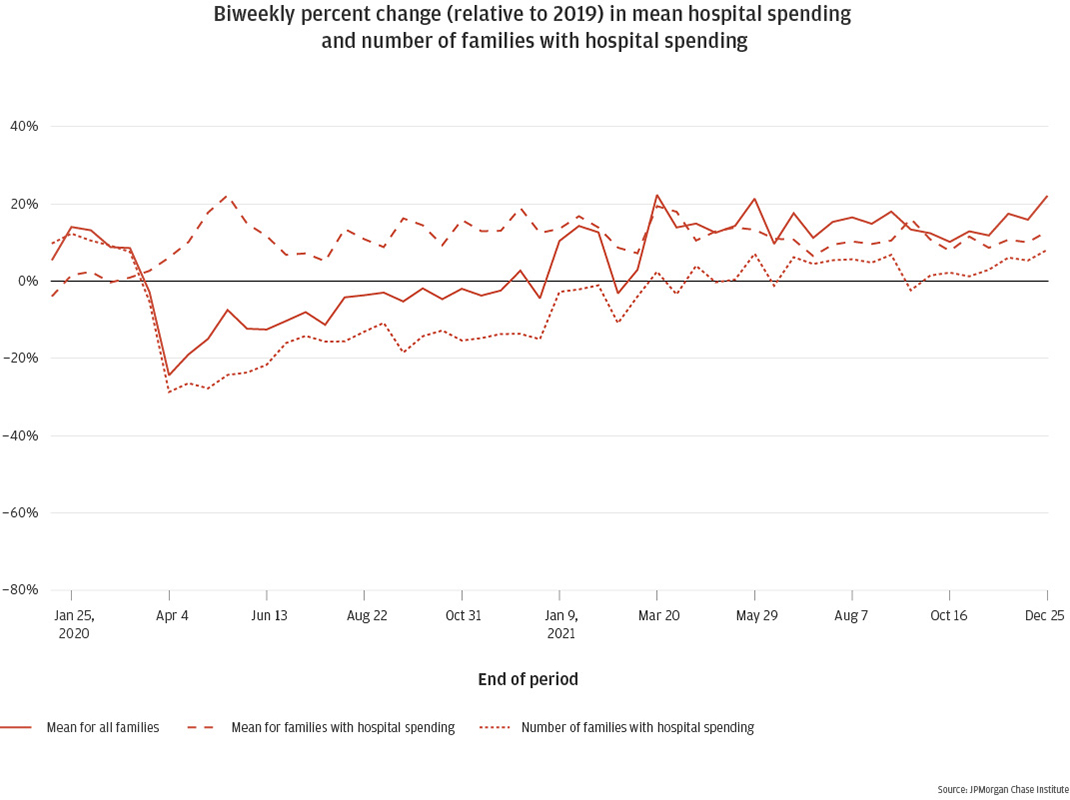
Figure 7d: Hospital
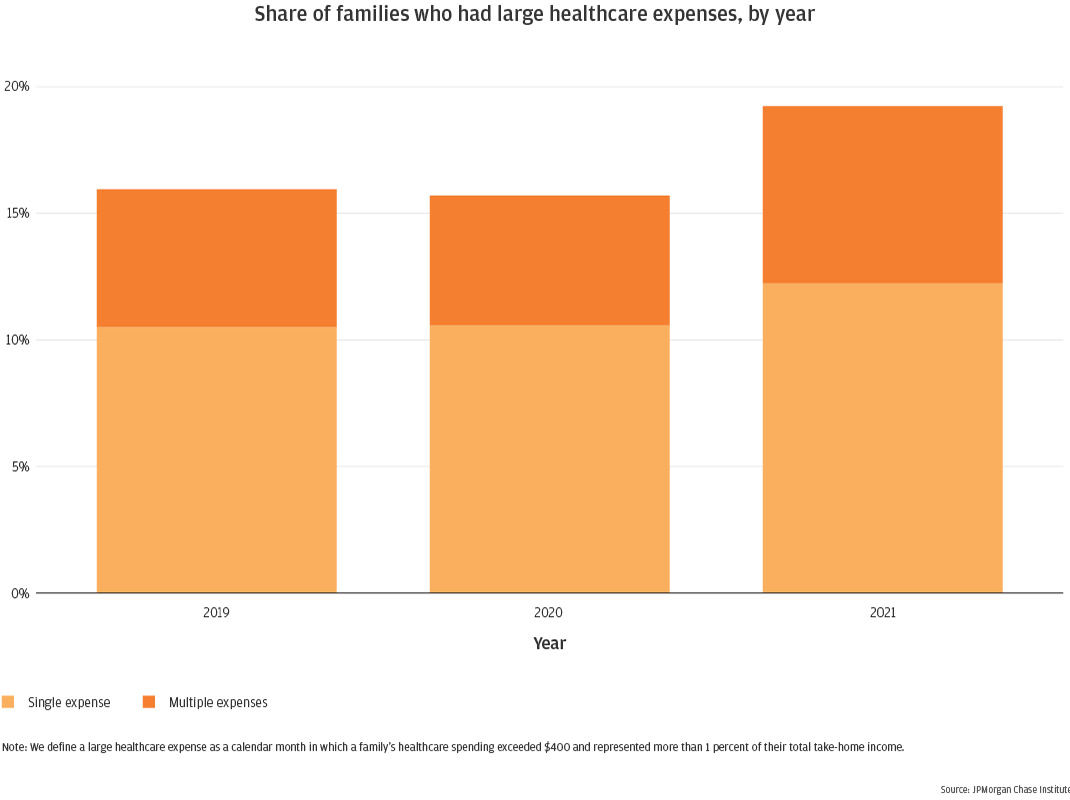
To understand healthcare spending more deeply, we ask what proportion of families experience large healthcare expenses, and how families’ financial lives evolve before and after a large healthcare expense (see Box 2). The 2020 Survey of Household Economics and Decisionmaking indicated that 35 percent of adults were not prepared to cover a $400 emergency expense without borrowing or selling something4. We use this $400 as a minimum threshold to categorize large healthcare expenses. For each family, we count the number of months within each year that their healthcare spending exceeded $400 and represented more than 1 percent of their total take-home income5 from that year. The results are shown in Figure 8.
Consistent with trends in overall healthcare spending reported in Finding One, in 2019 and 2020 roughly 16 percent of families experienced at least one large healthcare expense month, with one third of those families— or 5 percent of all families—experiencing two or more months in a single year. In 2021, those numbers had increased to roughly 19 percent with at least one large healthcare expense month, and 7 percent with two or more.
Figure 8: The proportion of families experiencing large healthcare expenses was steady between 2019 and 2020, increasing 3.5 percentage points in 2021
Box 2: Event Study Sample and Methodology
The aim of our event study is to understand the financial impacts of large healthcare expenses. The events of interest, as described in Finding Three, are calendar months in which a family’s healthcare spending exceeds 1% of their take-home income and totals more than $400. We will refer to these instances as the family’s large healthcare expense event, or simply the event.
We study families who experienced such a month in our Event Window of July 2018 through February 2019. For families in the study, we track their checking account and credit card balances over a 19-month period, from 6 months prior to the event until 12 months following the event. We require that families have only one event throughout their full 19-month timeframe, to provide a clear signal. Families with recurring large healthcare expenses are therefore excluded from this study.
In addition to the event conditions outlined above, event study eligibility also requires the same conditions as our primary sample described in Box 1, on an adjusted event study timeframe. Sample filters for checking account presence, minimal activity, and income associated with the checking account, as well as unknown spending thresholds all apply to the event study, over a window of January 2018 through February 2020. Due to our goal of tracking balances for both checking accounts and credit cards, the event study sample also requires the presence of an active Chase credit card between January 2018 and February 2020. Note that this requirement skews our event study sample higher-income than our main sample6.
We separate event study families into two groups7, based on their source of funding for their large healthcare expense events: did they pay for the event from their checking account, or their credit card? We assess these groups separately to understand differences in event impacts.
Finally, we compare outcomes of our event study families with outcomes from a control group8. Due to secular economic and behavioral trends, it can be difficult to assess balance trajectories following an event, without the ability to compare to a counter-factual group of similar families who did not experience a large healthcare expense event. Our control group is comprised of families who meet all of the above conditions but have no large healthcare expenses during the Event Window. For these families, we randomly assign a “time 0” (event time) within the Event Window and filter to families who have no large healthcare expenses in the prior 6 months or subsequent 12 months. We assess control group balance results in parallel with our treatment groups.
Event study results are measured as treatment-control differences in ratios to benchmarks. Specifically, for each family, we calculate a benchmark balance as the median balance during six to four months prior to the event (even time -6 through -4). At each of the 19 months in our study, we then compute the family-level ratio of current balance to benchmark balance and report the median of that ratio. To account for the secular trends in balances during our study (see Appendix Figure A1) we take the difference between the treatment and control balance ratios and report that difference as our primary result, interpreted as the amount of elevation or depression in the treatment group relative to pre-event benchmark and expectations of balance changes absent a large healthcare expense event (the control group difference).
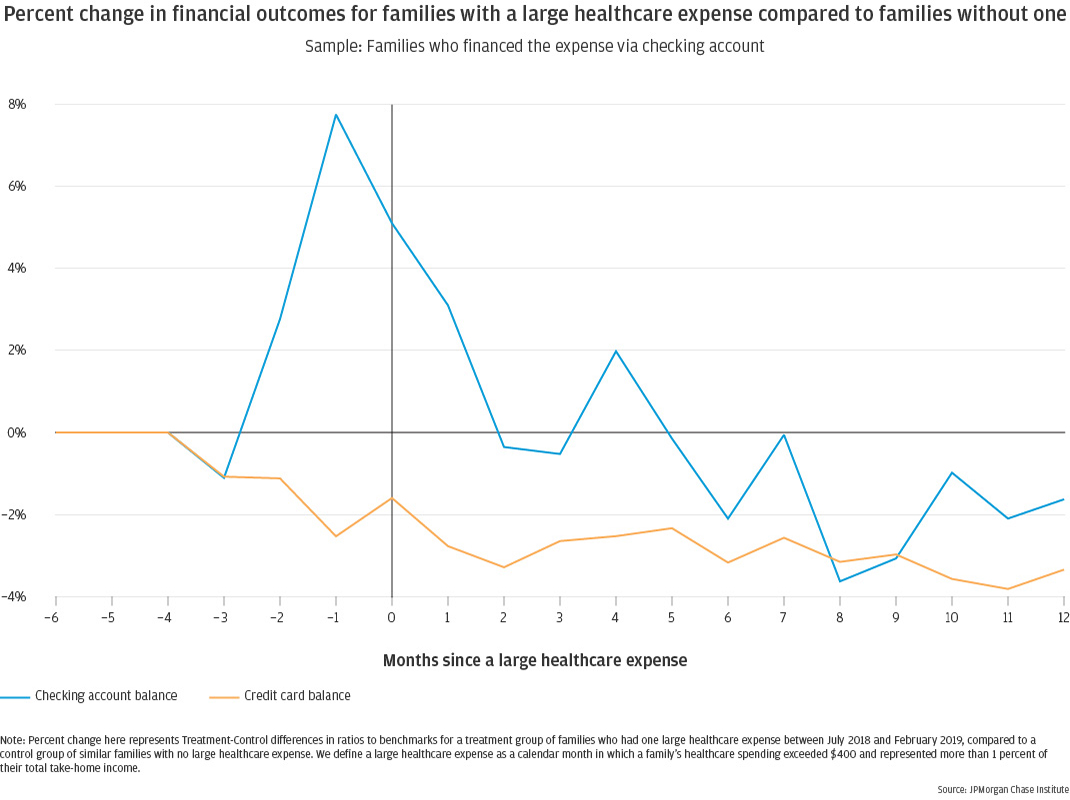
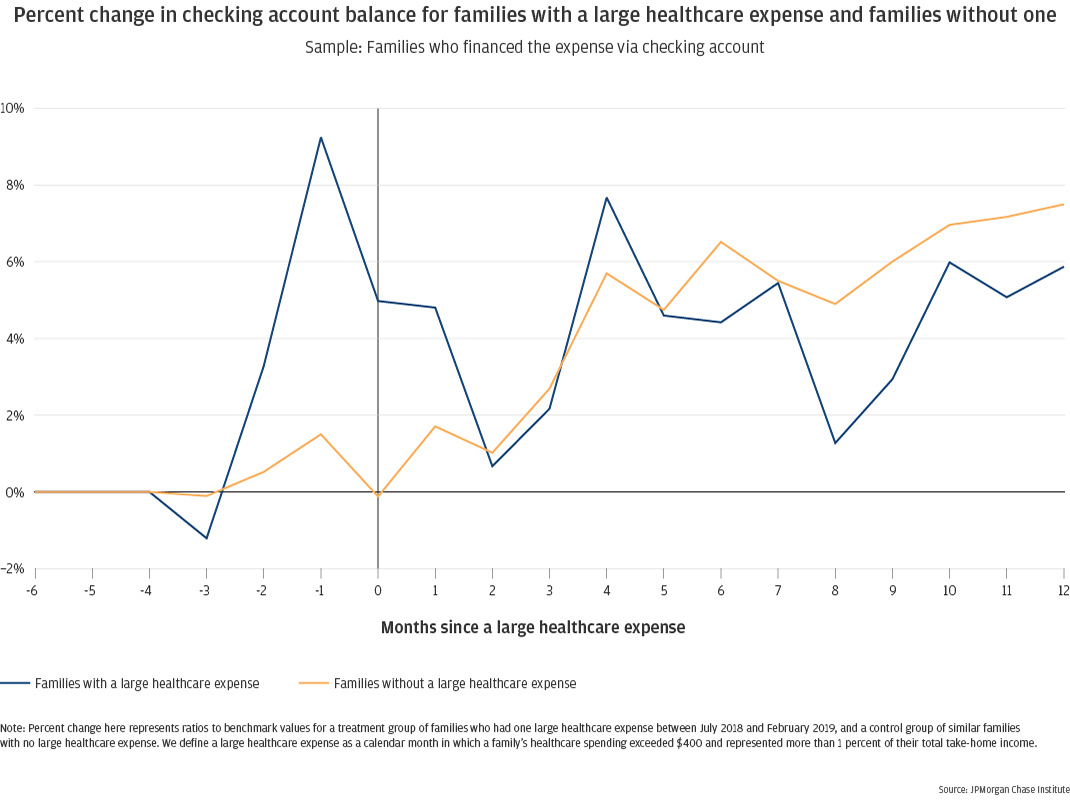
Next we evaluate how families’ financial lives evolve before and after a large healthcare expense (see Box 2). We examine separately families who paid for this large healthcare expense out of their checking account versus using a credit card. Focusing first on families who paid for their large healthcare expense using their debit card, checking account balances rose in the months preceding a large healthcare expense event, peaking at just under 8 percent elevated in the month before the event for families who financed the spending via their checking account (Figure 9). This is consistent with prior evidence that families increase their out-of-pocket healthcare spending when they have more cash on hand, such as in the week after they receive their tax refund (Farrell et al., 2019). In the months following the event, balances decreased, eventually becoming slightly depressed toward the second half of the year, reaching a low of nearly 4 percent depressed and ending the year roughly 2 percent down. While families may be moving funds into the checking account in anticipation of the spending event, it seems that anticipatory balance boost is not enough to fully fund the event plus subsequent months of potentially decreased health.
Over the same period, these families steadily decrease their credit card balances, beginning three months pre-event and reaching a new steady state two to three months post-event, of 2 to 4 percent depressed credit card balances. This may indicate pulling back on spending during a time of high healthcare bills.
Figure 9: Families who paid for their large healthcare expense via checking account had elevated checking account balances the month before the event, decreasing after the event and remaining depressed a year later; their credit card balances were marginally reduced throughout the year.
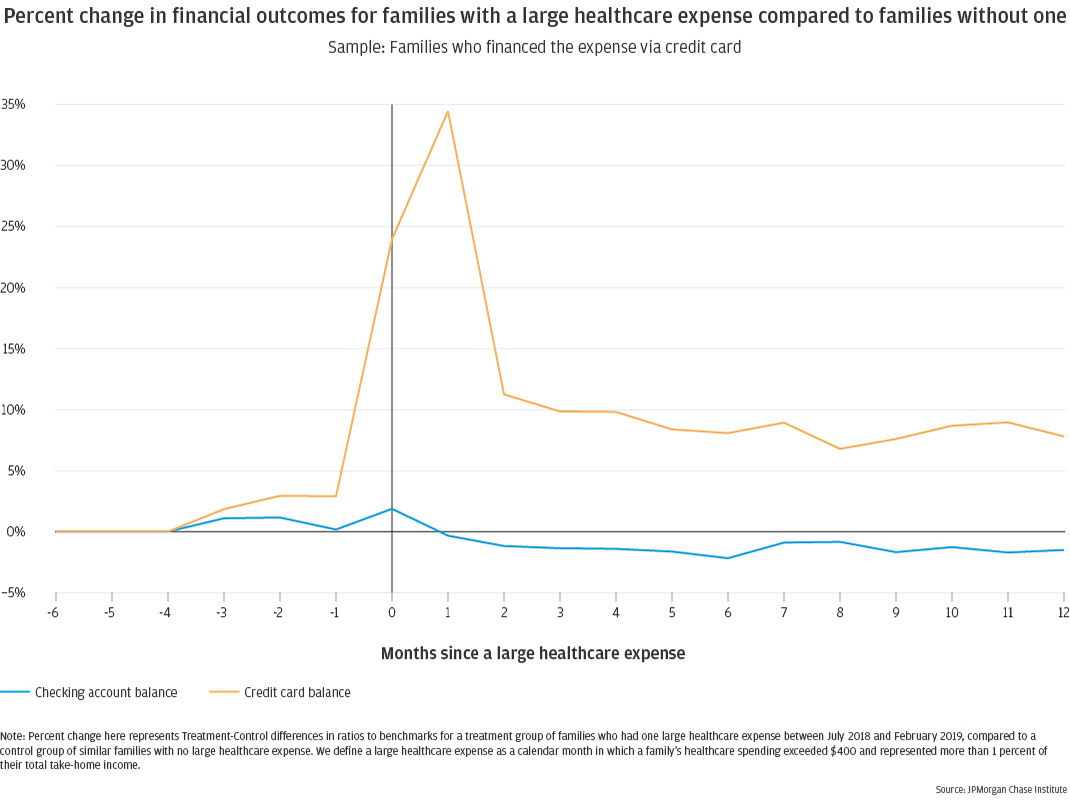
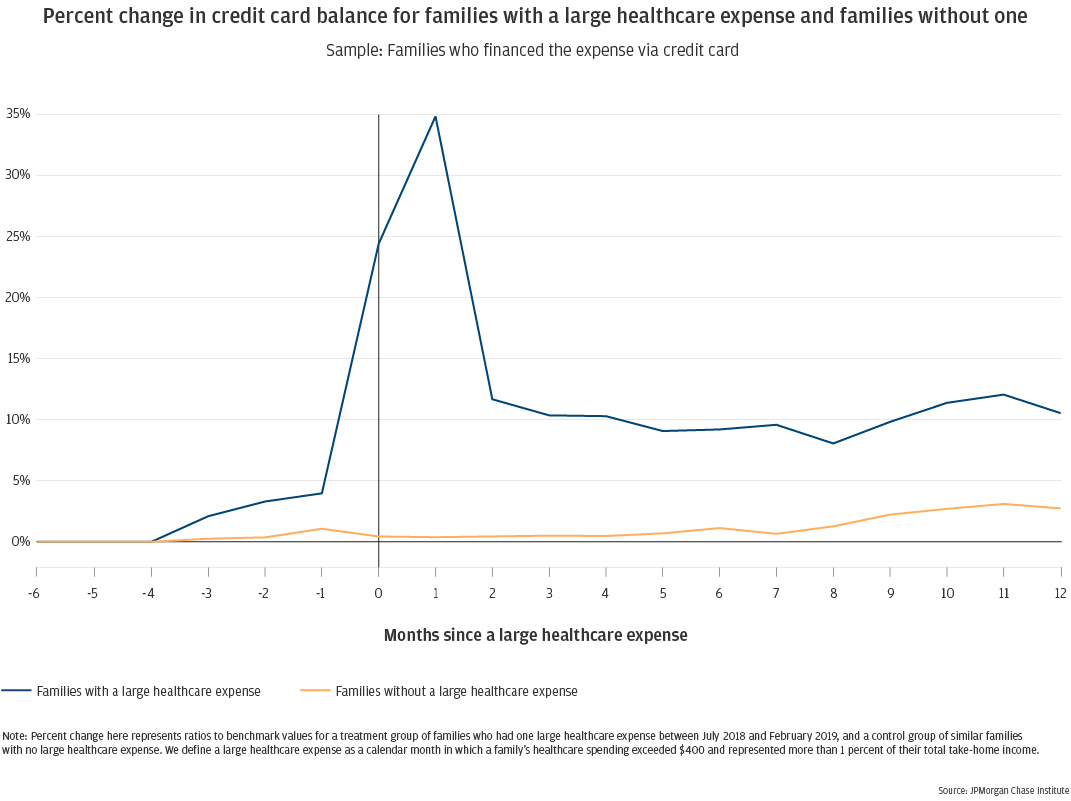
Different patterns emerge for families who financed their large healthcare expense via credit card. Checking account balances for these families remain relatively steady throughout the 19-month study period, becoming slightly depressed (1 to 2 percent) following the event (Figure 10). Their credit card balances spike to 34 percent elevated in the month following the event, when the event charge would appear on their billing statement. While balances decrease notably by the second month post-event, they do not fully return to previous levels, remaining 8 to 10 percent elevated for the full 12 months following the event, with no sign of further decrease.
Note that credit card balances represent the statement balance, which includes both new spending during the billing cycle and any revolving balances carried over from prior cycles without paying in full. So the continued elevation of these balances could indicate that families carry a portion of their large healthcare expense as revolving debt on their credit card during the year following the event. It could also indicate a new normal of higher monthly spending on the credit card, possibly related to follow-up care in the wake of the original event. We cannot currently parse the distinction.
Figure 10: Families who financed their large healthcare expense via credit card had credit card balances 34 percent elevated in the month following the event, remaining roughly 10 percent elevated throughout the following year; their checking account balances were marginally reduced throughout the year.
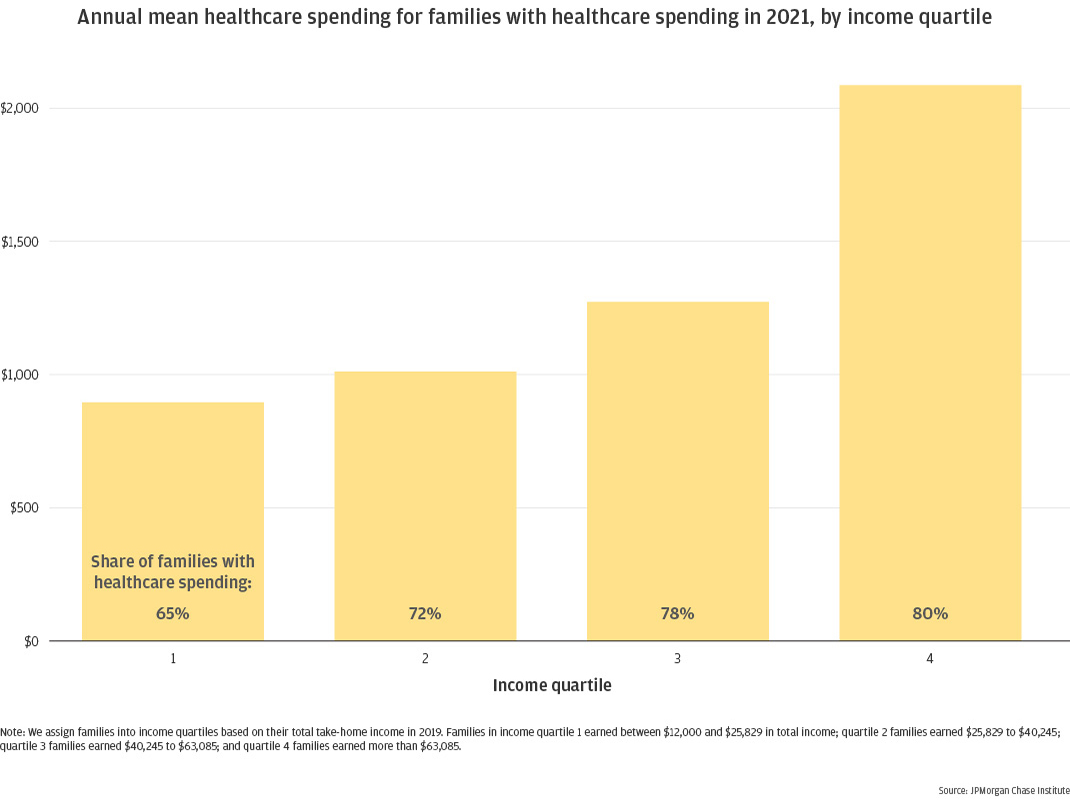
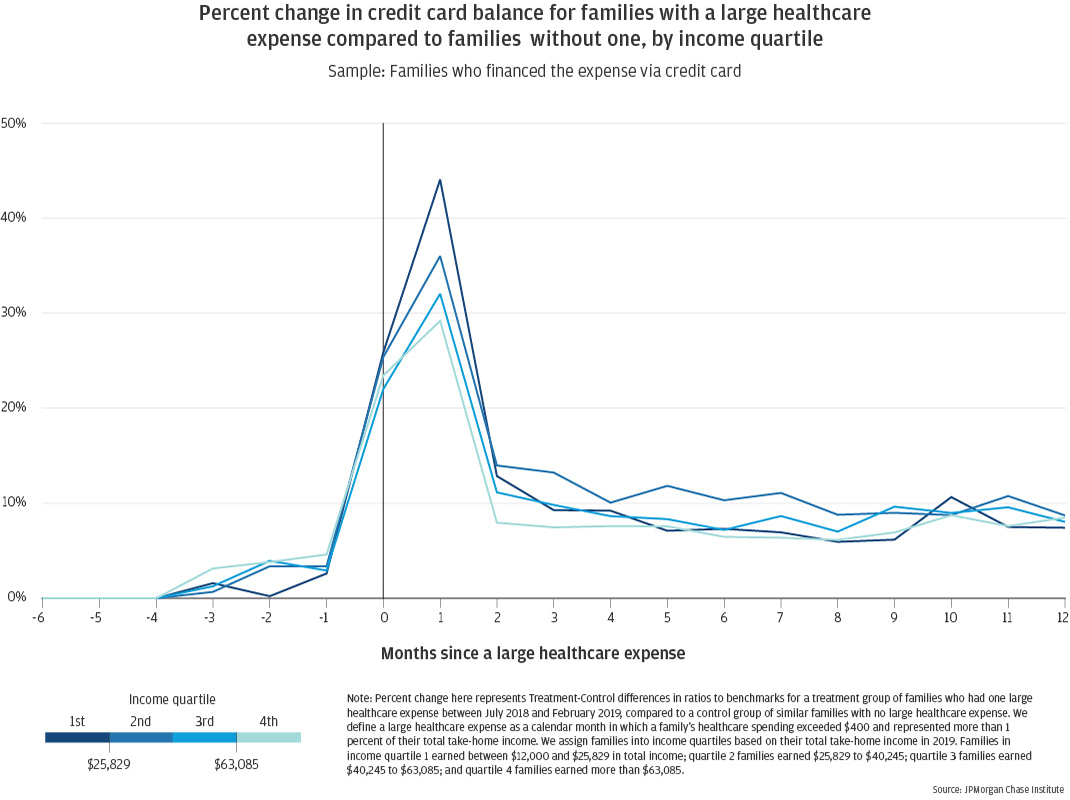
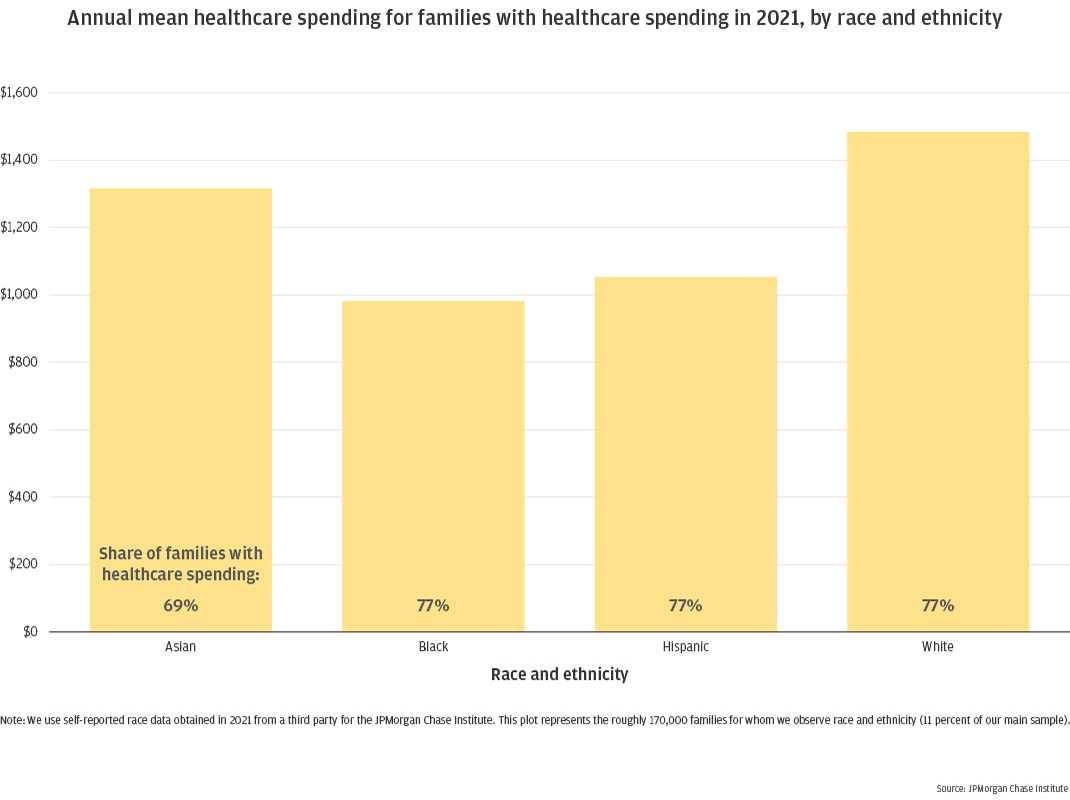
To understand how healthcare spending impacts families differently by demographics, we assess separately by income group and race (Finding Five). Here, we separate families into income quartiles based on pre-pandemic take-home income for calendar year 20199. For families with out-of-pocket healthcare spending, higher-income families spend more than lower-income families. This pattern has been well established elsewhere, including previous Institute research (Farrell and Greig, 2018). In fact, families in our highest income quartile (earning more than $63,085 per year) spent on average over $2,000 in 2021, more than double what families in quartiles 1 and 2 spent (Figure 11).
There are many factors that influence healthcare spending, including health insurance coverage and deductible amount, number and general health of family members, frequency of check-ups and preventative care, and accessibility of healthcare facilities. Some of these factors may correlate with income, influencing these results. We also note that, relative to available family resources, the healthcare spending trend reverses: as a proportion of take-home income, the lowest-income families spend the most on healthcare (3.7 percent), while families in the highest income quartile spend notably less (2.2 percent).
Figure 11: In 2021, low-income families with out-of-pocket medical expenses spent less per family than higher-income families, with the highest income quartile spending notably more than the lower three.
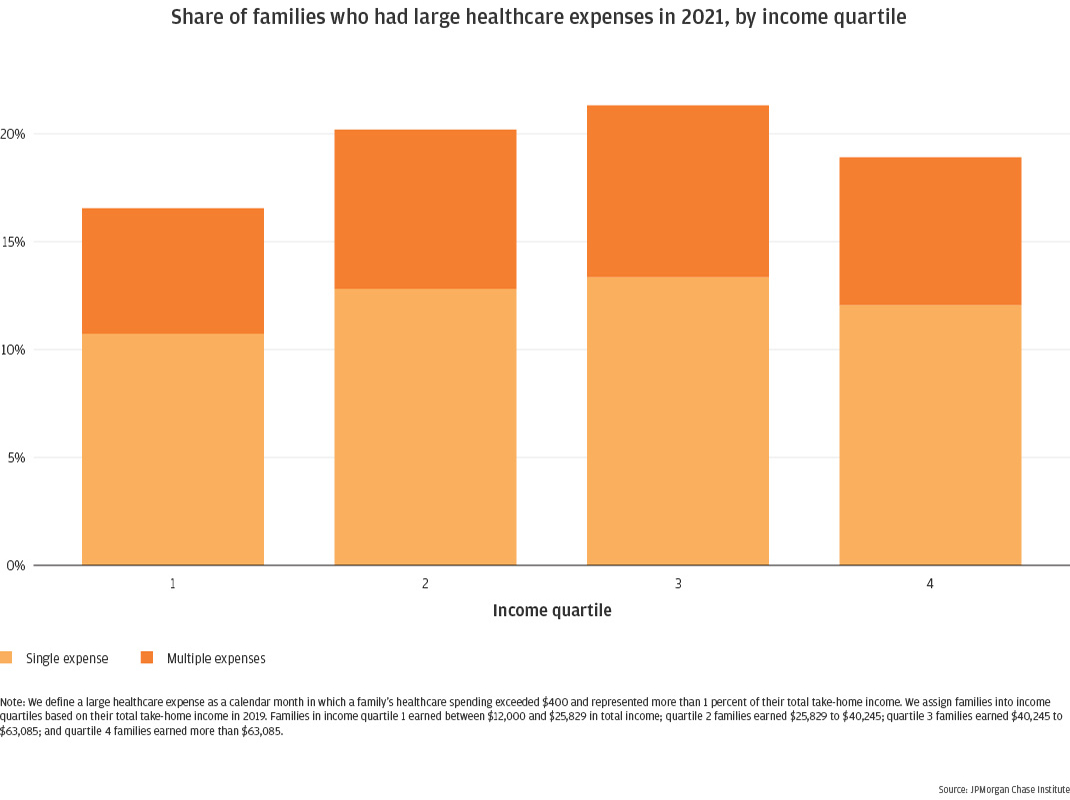
Figure 12: In 2021, families in the lowest income quartile experienced large healthcare expenses less frequently than higher-income families.
In keeping with the above trends, we also observe that the lowest earning families experience large healthcare expense events less frequently than their higher-earning counterparts (Figure 12). We see a steady increase in occurrence in the first three income quartiles, with the highest quartile decreasing relative to quartile 3 (though still higher than quartile 1). This is because of the dual condition used to classify large healthcare expenses, setting a higher per-month bar for quartile 410.
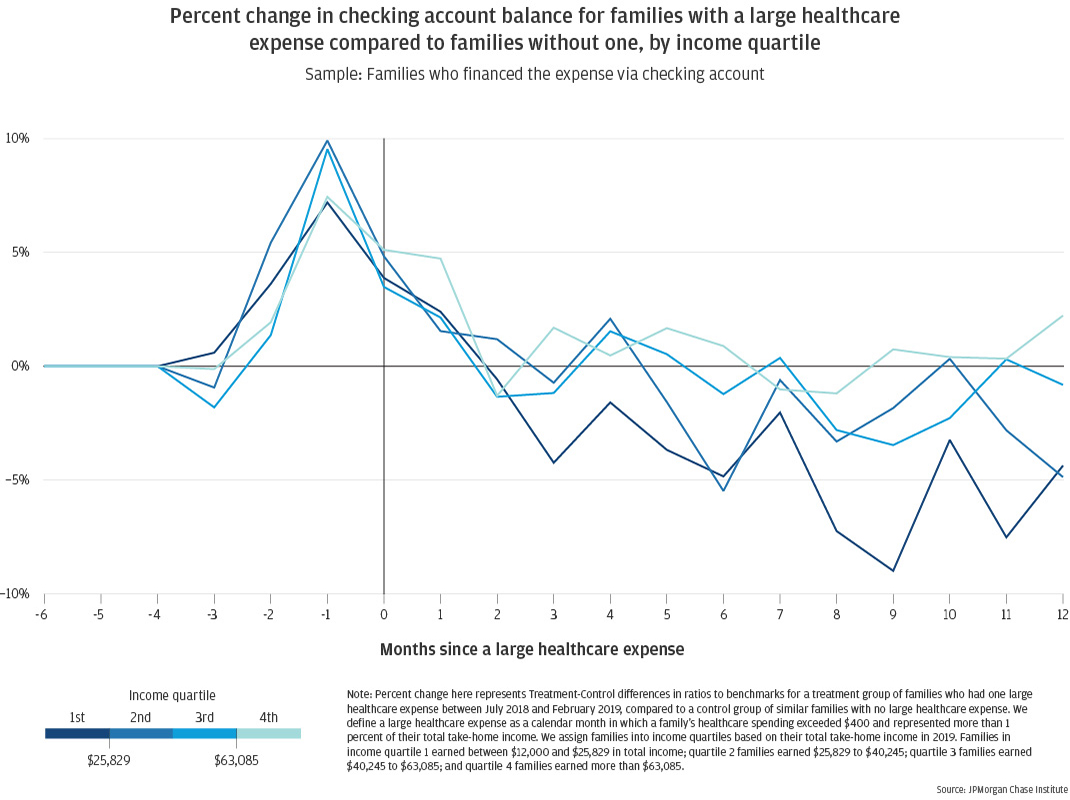
For the families incurring large healthcare expenses, impacts on checking account and credit card balances are more pronounced for the lowest-income families. Figure 13 shows that the lowest earning families experienced the greatest depressions in checking account balances following a large healthcare expense event, with balances down by 9 percent at their lowest and still depressed by 5 to 7 percent at the end of the year. In contrast, the highest earning families maintained pre-event balances throughout the year.
Low-income families who finance these events via credit card did not fare worse on card balances in the year following the event, when all income groups remained elevated by 7 to 10 percent (Figure 14). The only distinction of low-income families in this group was their higher initial balance spike in the month following the spending event, when balances were up 44 percent for quartile 1 families compared to just 29 percent for quartile 4 families.
Figure 13: Low-income families who paid for their large healthcare expense via checking account experienced greater declines in account balances than high-income families.
Figure 14: Low-income families who financed their large healthcare expense via credit card experienced the greatest balance elevation in the month following the event, remaining elevated throughout the following year to a similar extent as the other income quartiles.
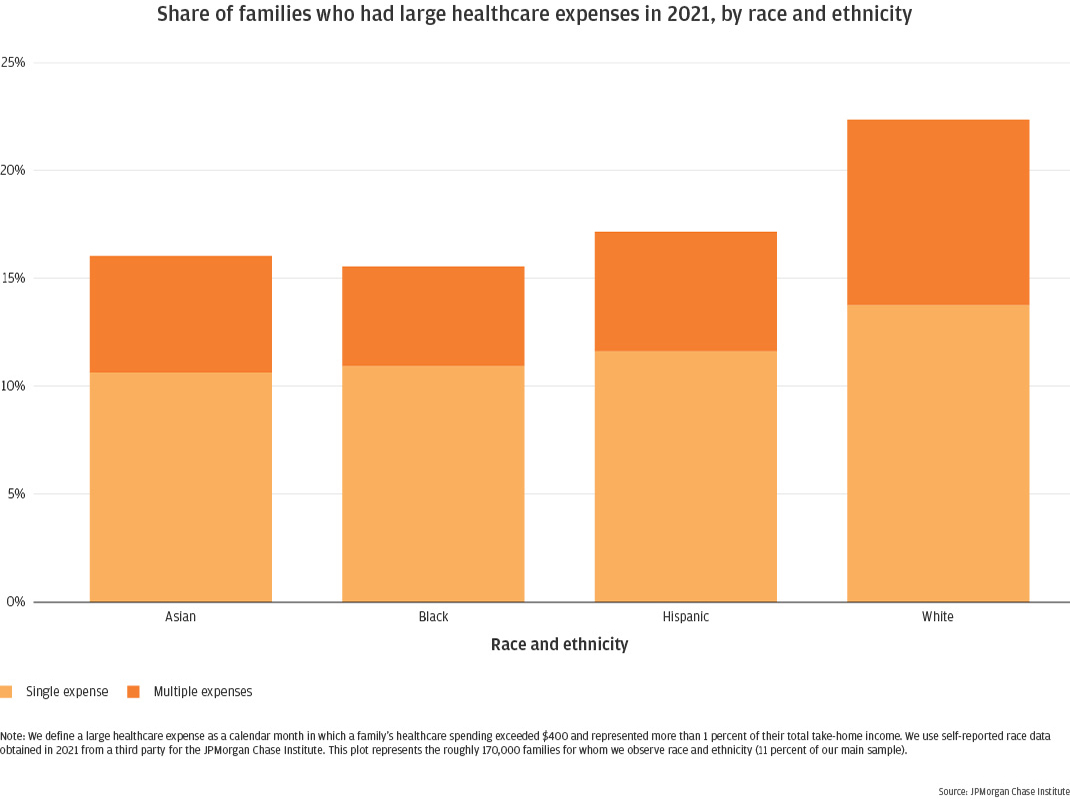
Using the 11 percent of our sample for whom we have self-reported race data11 we observe that White families had the highest out-of-pocket healthcare spending, with Asian families spending slightly less and Black and Hispanic families notably lower12 (Figure 15). White families out-spent Asian families by 13 percent, Hispanic families by 41 percent, and Black families by 51 percent. Likewise, when assessing how many families experience large healthcare expenses within a year, White families are notably higher than their counterparts, with 22 percent experiencing large healthcare expense events compared to 16 to 17 percent of Asian, Black, and Hispanic families (Figure 16).
While there are underlying racial differences in income, these differences between White and non-White families persist even when comparing within comparable income bands. White families continue to have the highest average annual healthcare spending within each income quartile, and White families continue to experience large healthcare expenses. These trends, therefore, are not artifacts of income differences, but are driven by other factors. As noted above, many factors influence out-of-pocket spending on healthcare. Some of these, including access to healthcare facilities, may contribute to race-based differences in healthcare spending. Indeed, the Kaiser Family Foundation found that Black and Hispanic families fare worse than their White counterparts on measures of health coverage, access, and use (Hill et al., 2022).
Figure 15: In 2021, White and Asian families with out-of-pocket medical expenses spent more per family than Black and Hispanic families.
Figure 16: In 2021, White families experienced large healthcare expenses more frequently than Asian, Black, and Hispanic families.
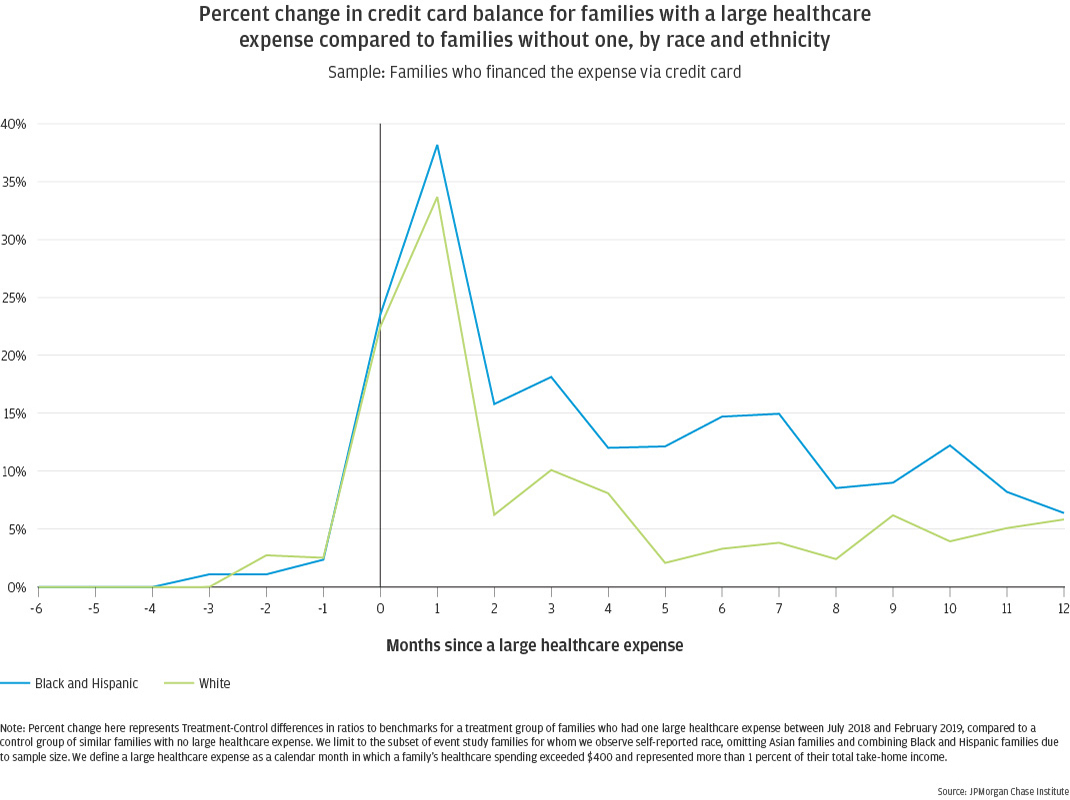
While White families experience large healthcare expenses more frequently than Black and Hispanic families, the latter experience greater financial impacts following such events. Figure 17 shows that credit card balances are more elevated for Black and Hispanic families in the month following an event, up by 38 percent compared with 34 percent for White families. While this elevation tapers off over subsequent months, Black and Hispanic families’ credit card balances remain 10 to 15 percent elevated for much of the year, decreasing somewhat by month 12. White families’ balances, on the other hand, decrease more in month 2 and remain 5 to 10 percent elevated through month 4, and less than 5 percent for most of the year, finishing out month 12 around 6 percent.
Note that the intersection of our event study sample and self-reported race data is quite small, covering 56,500 families in total, only 2,600 of which are in the treatment groups13. We have omitted Asian families due to sample size and combined Black and Hispanic families. And, as discussed above, our event study sample skews slightly higher income than our overall sample due to the inclusion of a credit card requirement. This has an even greater impact on the non-White families in our sample, removing a greater proportion of them. Nevertheless, the trends shown in Figure 17 offer a rare and compelling glimpse into the differential impacts of large spending events by race. The greater, more prolonged elevation of balances for Black and Hispanic families will have real impacts in terms of greater interest charges, and possibly impacts to credit reports. More research is needed in this space to better assess these differences and their impacts on debt and other credit outcomes.
Figure 17: Black and Hispanic families who financed their large healthcare expense via credit card experienced greater balance elevation in the year following the event, compared to White families.
Families deferred healthcare during the COVID-19 pandemic and may not have fully caught back up. The number of families with out-of-pocket healthcare spending decreased by nearly 50 percent at its lowest point in April 2020 (Figure 3). Both the number of families incurring healthcare spending, and the amount those families spent per week decreased, contributing to the overall depression in mean healthcare spending. As a result, annual healthcare spending for 2020 decreased relative to 2019 in real dollars (Figure 7), despite historical trends of annual increases in this metric. Annual spending increased again in 2021, but annual growth rates between 2019 and 2021 were lower than prior estimates led us to expect, indicating that families may not have fully caught up on the healthcare spending that they deferred during the pandemic.
Healthcare spending decreased most in more discretionary categories of dentist and vision but took longer to recover in essential categories of hospital and doctors’ offices. The number of families with out-of-pocket healthcare spending decreased the most in more discretionary categories like dentist and vision, with each depressed by more than 70 percent at their lowest point (Figures 7a and 7b). Decreases in incidence of more essential healthcare categories were less pronounced—50 percent for doctors, 24 percent for hospitals—but recovered more slowly, remaining depressed until spring of 2021 (Figures 7c and 7d). For these latter categories, the amount spent per family was elevated while the number of families was depressed, perhaps indicating that the larger or more critical services were the ones still being sought, while deferring more routine services.
Large healthcare expenses can continue to impact families’ finances for a year or more after the event. Following a month in which healthcare spending exceeds $400 and 1 percent of family income, checking account balances decline and remain roughly 2 percent depressed 12 months later, regardless of how the family paid the large expense. For families who financed the expense via their credit card, statement balances reach a new steady state of 8 to 10 percent elevated for the 12 months following the event, with no sign of further decrease.
Large healthcare expenses pose a financial risk, especially for lower-income and Black and Hispanic families. Following a month in which healthcare spending exceeds $400 and 1 percent of family income, low-income families fared worse than their higher-income counterparts, experiencing sustained depletions in their cash balances, which remained 5 percent depressed a full year after the initial expense. Black and Hispanic families experienced larger and more prolonged increases in their credit card balances than White families following a large healthcare expense. We highlight two important ongoing implications of these results. First, Black and Hispanic families experience higher rates of COVID infection and adverse outcomes than White families, and are disproportionately impacted by surges due to new variants (Hill and Artiga, 2022). Larger and more prolonged financial consequences of large healthcare expenses for Black and Hispanic families, compounded with these ongoing pandemic effects will likely result in disproportionate financial strain on Black and Hispanic families. Second, recent increases in average deductible amounts and share of families with high-deductible plans2 will pose greater financial risks for low-income and minority families, given their greater vulnerability to large healthcare expenses. This is particularly true for Black and Hispanic families, who fare worse than White families on measures of healthcare coverage (Hill et al., 2022).
Farrell, Diana and Fiona Greig. 2018. “On the Rise: Out-of-Pocket Healthcare Spending in 2017.” JPMorgan Chase Institute. https://www.jpmorganchase.com/content/dam/jpmc/jpmorgan-chase-and-co/institute/pdf/institute-on-the-rise-report.pdf
Farrell, Diana, Fiona Greig, and Amar Hamoudi. 2019. “Tax Time: How Families Manage Tax Refunds and Payments.” JPMorgan Chase Institute. https://www.jpmorganchase.com/content/dam/jpmc/jpmorgan-chase-and-co/institute/pdf/institute-tax-time-report-full.pdf
Greig, Fiona and Erica Deadman. 2021. “Financial outcomes by race during COVID-19.” JPMorgan Chase Institute. https://www.jpmorganchase.com/institute/research/household-income-spending/financial-outcomes-by-race-during-COVID-19
Hill, Latoya, Samantha Artiga, and Sweta Haldar. 2022. “Key Facts on Health and Health Care by Race and Ethnicity.” Kaiser Family Foundation. https://www.kff.org/racial-equity-and-health-policy/report/key-facts-on-health-and-health-care-by-race-and-ethnicity/
Hill, Latoya, and Samantha Artiga. 2022. “COVID-19 Cases and Deaths by Race/Ethnicity: Current Data and Changes Over Time.” Kaiser Family Foundation. https://www.kff.org/coronavirus-covid-19/issue-brief/covid-19-cases-and-deaths-by-race-ethnicity-current-data-and-changes-over-time/
Wheat, Chris, Chi Mac, and James Duguid. 2021. “Retail Spending Response to Local Conditions during COVID-19.” JPMorgan Chase Institute. https://www.jpmorganchase.com/institute/research/cities-local-communities/retail-spending-response-to-local-conditions-during-covid-19
We thank our research team, specifically Jiaqi Dong and Tanya Sonthalia, for their hard work and contributions to this research. Additionally, we thank Sarah Kuehl, Emily Rapp, Robert Caldwell, Samantha Anderson, and Noah Forougi for their support. We are indebted to our internal partners and colleagues, who support delivery of our agenda in a myriad of ways, and acknowledge their contributions to each and all releases.
We are also grateful for the invaluable constructive feedback we received from external experts and partners. We are deeply grateful for their generosity of time, insight, and support.
We would like to acknowledge Jamie Dimon, CEO of JPMorgan Chase & Co., for his vision and leadership in establishing the Institute and enabling the ongoing research agenda. We remain deeply grateful to Peter Scher, Vice Chairman, Demetrios Marantis, Head of Corporate Responsibility, Heather Higginbottom, Head of Research & Policy, and others across the firm for the resources and support to pioneer a new approach to contribute to global economic analysis and insight.
This material is a product of JPMorgan Chase Institute and is provided to you solely for general information purposes. Unless otherwise specifically stated, any views or opinions expressed herein are solely those of the authors listed and may differ from the views and opinions expressed by J.P. Morgan Securities LLC (JPMS) Research Department or other departments or divisions of JPMorgan Chase & Co. or its affiliates. This material is not a product of the Research Department of JPMS. Information has been obtained from sources believed to be reliable, but JPMorgan Chase & Co. or its affiliates and/or subsidiaries (collectively J.P. Morgan) do not warrant its completeness or accuracy. Opinions and estimates constitute our judgment as of the date of this material and are subject to change without notice. No representation or warranty should be made with regard to any computations, graphs, tables, diagrams or commentary in this material, which is provided for illustration/reference purposes only. The data relied on for this report are based on past transactions and may not be indicative of future results. J.P. Morgan assumes no duty to update any information in this material in the event that such information changes. The opinion herein should not be construed as an individual recommendation for any particular client and is not intended as advice or recommendations of particular securities, financial instruments, or strategies for a particular client. This material does not constitute a solicitation or offer in any jurisdiction where such a solicitation is unlawful.
Greig, Fiona, Erica Deadman. 2022. “Healthcare spending through the Pandemic: the impact of high-cost medical events on household finances”. JPMorgan Chase Institute. https://www.jpmorganchase.com/institute/research/healthcare/spending-during-the-pandemic


JPMorgan Chase & Co.'s website terms, privacy and security policies don't apply to the site or app you're about to visit. Please review its website terms, privacy and security policies to see how they apply to you. JPMorgan Chase & Co. isn't responsible for (and doesn't provide) any products, services or content at this third-party site or app, except for products and services that explicitly carry the JPMorgan Chase & Co.