We no longer support this browser. Using a supported browser will provide a better experience.
Please update your browser.
Introduction
Fear of illness and death, restrictions on commercial activity, and adaptation by businesses and consumers mean that the retail landscape in the United States is a very different one after the onset of the COVID-19 pandemic. We are changing not only the amount we spend on retail goods and services, but also how and where we spend it. While the pandemic has been a collective experience, the severity of the pandemic’s effects has varied across time, communities, and sectors of the economy.1 Given this heterogeneity and the changes the pandemic has caused in retail activity, we might expect that retail spending would be relatively responsive to local conditions, such as local COVID death rates and restrictions imposed by non-pharmaceutical interventions (NPIs). To assess this, we use credit and debit card transaction data from over 40 million Chase customers to compare retail spending across metropolitan areas. COVID deaths per capita—as a local measure of the severity of the pandemic—do not appear to precipitate a consistent reaction in consumer spending. Furthermore, restrictions on restaurants do not appear to be strongly associated with changes in restaurant spending.
The data
This analysis relies solely on publicly available data on retail spending, COVID deaths, and NPIs. In April 2021, the JPMorgan Chase Institute launched the latest version of its “Local Commerce Data Series.” This project provides regularly updated series of consumer spending growth for 15 metropolitan areas in the United States, along with a national aggregation.2 These series are constructed using credit and debit card transaction data from over 40 million Chase customers a month. We provide a “buyers” view of local commerce. This means we aggregate spending by people who live in a given metro area, wherever that spending occurred. We provide breakouts of spending growth by age group, product type, and transaction channel (whether a transaction is online or offline), along with contributions to top line spending growth by subcategories of these dimensions. Each month, we provide charts for all our series, as well as the aggregated data underlying those charts. Spending is aggregated at the month, metro area, and age group/product/channel level in accordance with our aggregation and data privacy standards.
To measure COVID death rates, we use county-level data collected by The New York Times from state and local health agencies.3 To include information on NPIs, we used a tool created by the Yale School of Management that collects county-level information for all states. In addition to directly informing policy through the analysis of a novel data source, we aim to provide an example of how these data can be combined with other sources to inform decision-makers at the local and national levels. The specialized knowledge and perspective of local policymakers and experts may also provide a more complete assessment of the relationship between local conditions and consumer spending.
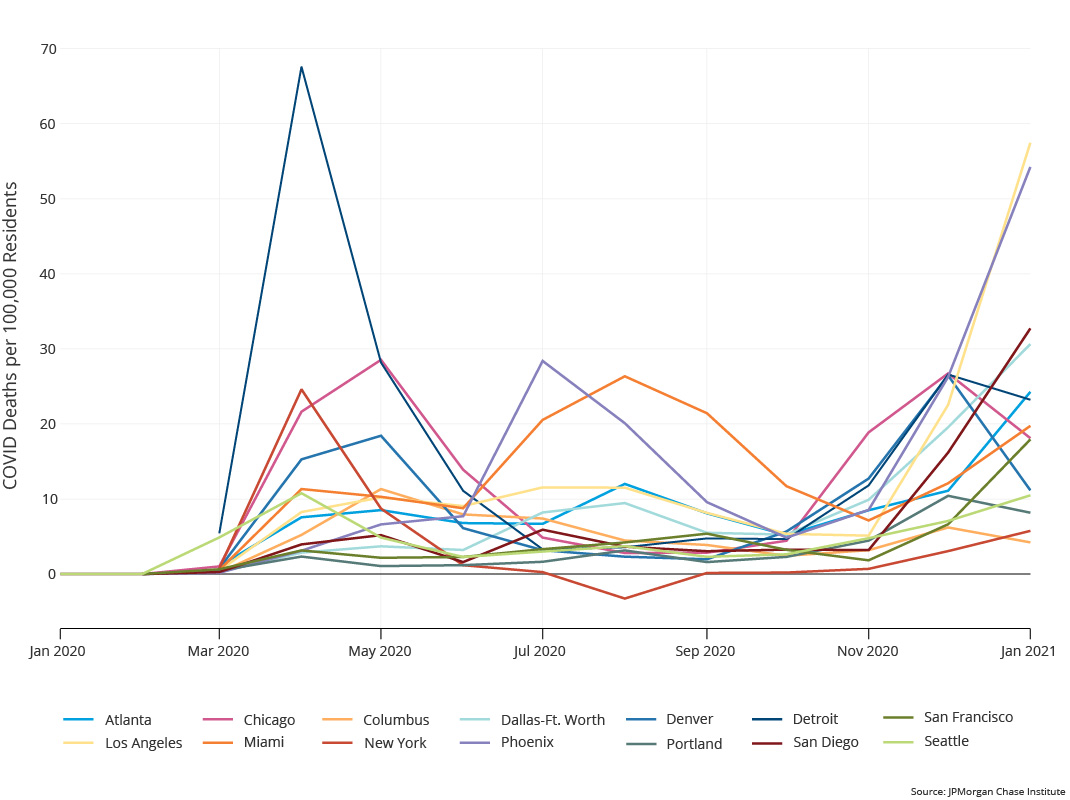
To assess the consumer spending response to the severity of the pandemic, we computed the monthly number of COVID deaths per 100,000 residents for each metro area. Previous research has suggested that voluntary declines in mobility and economic activity were an important driver of economic contraction in the early months of the pandemic (Goolsbee and Syverson 2020; Chetty et al. 2020) and that economic activity in a state decreased as the number of COVID cases increased (Chen et al. 2020). However, focusing on the local COVID death rate (one reasonable measure of local pandemic conditions) and local consumer spending shows that consumers’ behavior has changed since the first months of the pandemic. Figure 1 demonstrates how the 15 metro areas we track in our series saw the number of deaths per 100,000 residents take different trajectories over the course of 2020.4
Figure 1: COVID death rates spiked at different times across metro areas
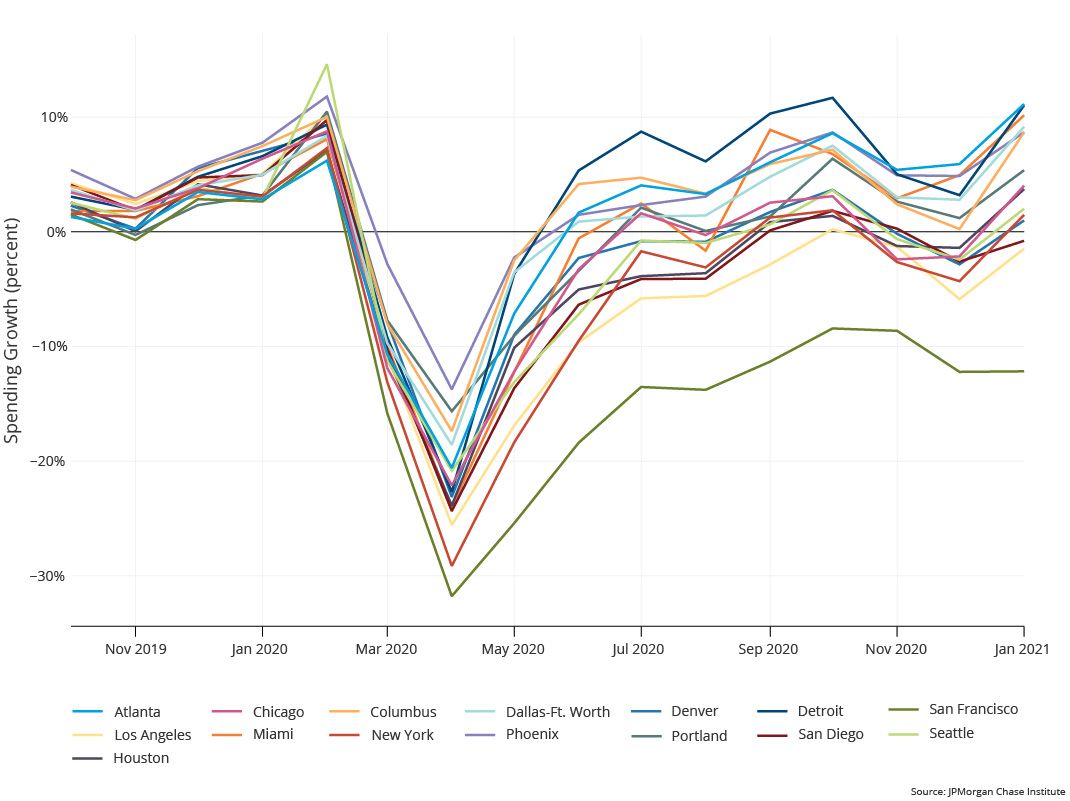
Figure 2 demonstrates that consumer spending growth trajectories were quite similar across metro areas over the same time period. While the pandemic arrived at different times across cities, consumers reacted to the national health emergency in concert.
Figure 2: Spending growth rates followed similar trajectories across metro areas
Through the rest of 2020, spending growth followed similar trajectories of recovery, while COVID death rates spiked in different metro areas at different times. Specifically, we find that the COVID death rate in a metro area in a given month was not a statistically significant predictor of spending growth.5 The relative similarity of spending across metro areas and weak relationship between local spending and local COVID death rates follows research on small businesses and their owners by Kim et al. (2020), who suggest that “business disruptions are primarily attributable to national factors unrelated to local infections.”
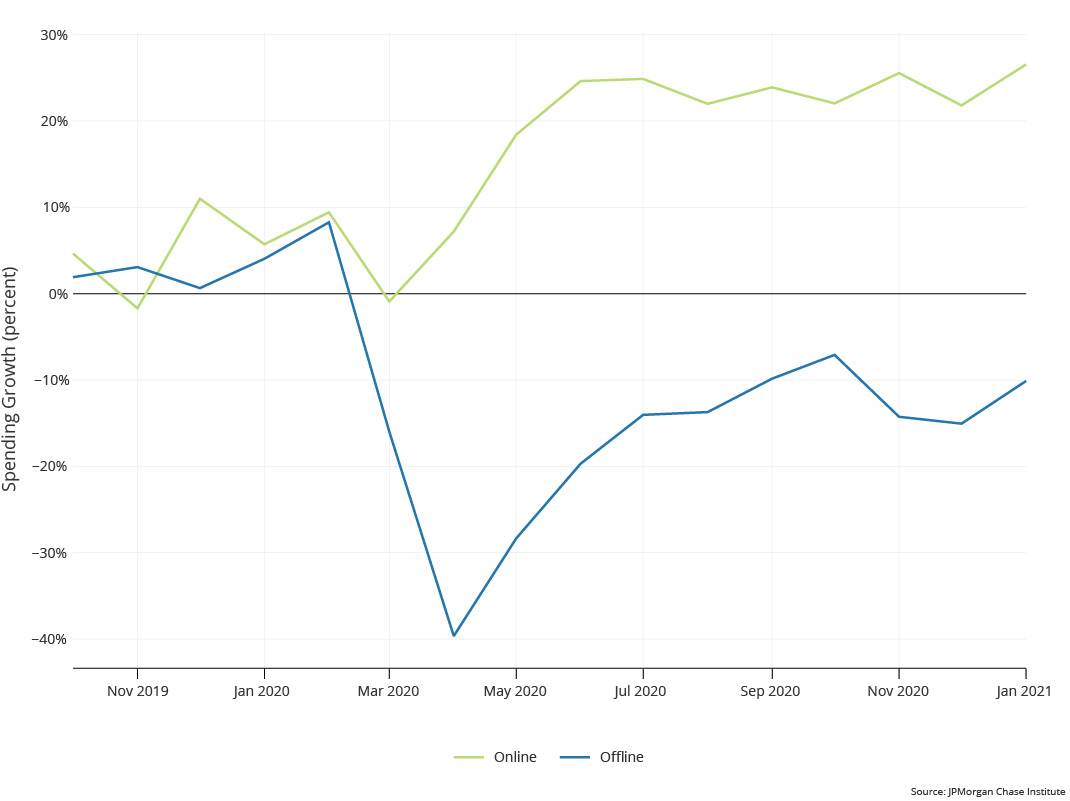
Given the emphasis on mobility in previous research, it is worth noting that one explanation for the smoother recovery of spending despite fears of infection is that consumers are increasingly taking advantage of online commerce. One of the advantages of the Local Commerce Data Series over other retail spending series is that it provides a breakout of spending growth by channel (online or offline). As Figure 3 illustrates, online spending grew rapidly after April 2020 and has remained higher than it was in 2019.
Figure 3: Online spending grew rapidly starting in April 2020, remaining high throughout the year
However, after the initial drops in March and April 2020, offline spending recovered at a similar rate until November 2020.
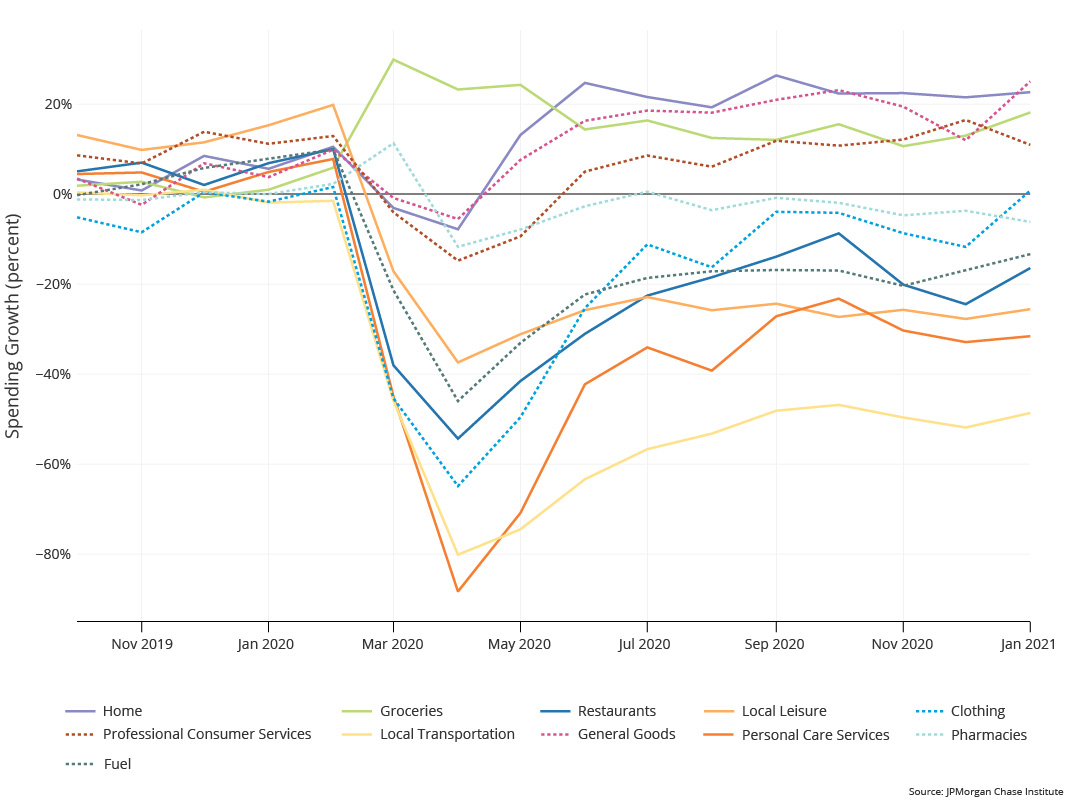
In addition to consumers changing spending patterns across channel, consumers changed the way they spent across different sectors of the retail economy. As shown in Figure 4, spending on groceries and home goods and services remained robust through the pandemic, outperforming spending growth in the previous year. However, as might be expected, spending on activities that require more in-person interaction, like personal care services, restaurants, local transportation, and local leisure was the hardest hit and had the weakest recovery.6
Figure 4: Spending growth across products diverged substantially after March 2020
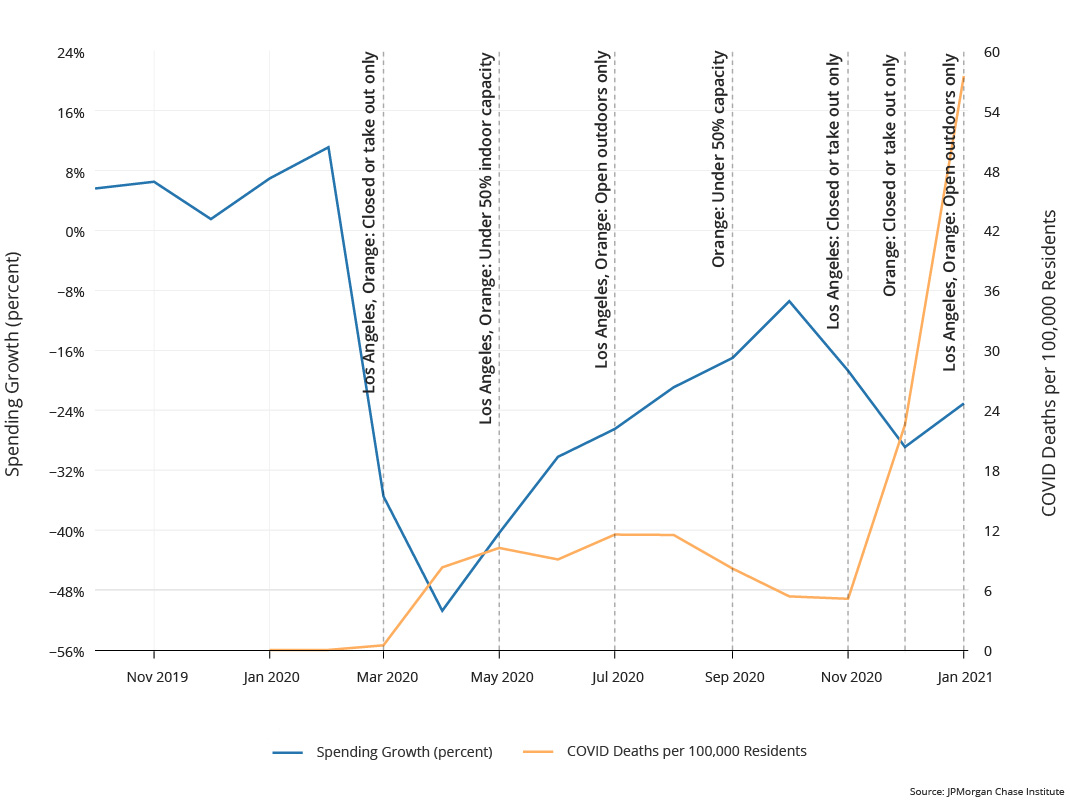
We compared how consumers responded to differing COVID death rates and levels of restriction to inform the debate over the costs and benefits of targeted NPIs. We looked at four metro areas with different approaches to NPIs targeting restaurants and different trajectories of COVID deaths per 100,000 residents: Los Angeles, Miami, Phoenix, and Seattle. Because consumers can substitute local offline spending for non-local online spending, what is presented as a more uniform recovery for consumers in a metro area may not imply recovery for businesses.7 We therefore focus on restaurant spending in this analysis because it is a sector where most, if not all, online and offline spending goes to establishments in the metro area.
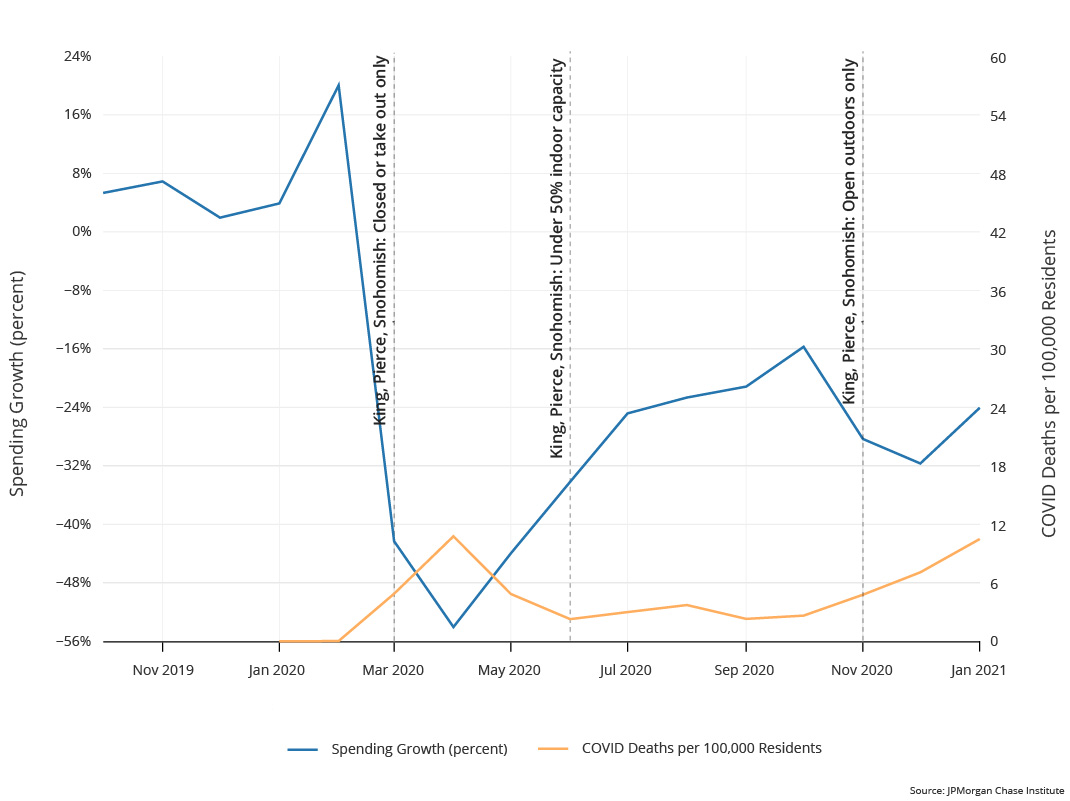
Figures 5a and 5b show two metro areas with similar restaurant spending growth trajectories and very different COVID death rates: Los Angeles and Seattle. In both metro areas, restaurant spending was more than 50 percent lower in April 2020 than in April 2019. Los Angeles restaurants were permitted to operate at 50 percent capacity starting in May 2020, although they were restricted to outdoor dining starting in July. In Seattle, restaurants were not permitted to operate indoors until June 2020. However, both metro areas saw similar recovery in restaurant spending through the summer even as NPIs changed and at times became more restrictive. In November 2020, both cities further restricted restaurant operations as COVID death rates rose. Although restaurant spending growth initially declined, it later increased despite continuing restrictions and increasing COVID death rates, particularly in Los Angeles. The trajectories of restaurant spending in Los Angeles and Seattle suggest that NPIs alone do not necessarily impede retail activity.
Figure 5a: NPIs are not associated with substantial changes in the trajectory of restaurant spending: Los Angeles
Figure 5b: NPIs are not associated with substantial changes in the trajectory of restaurant spending: Seattle
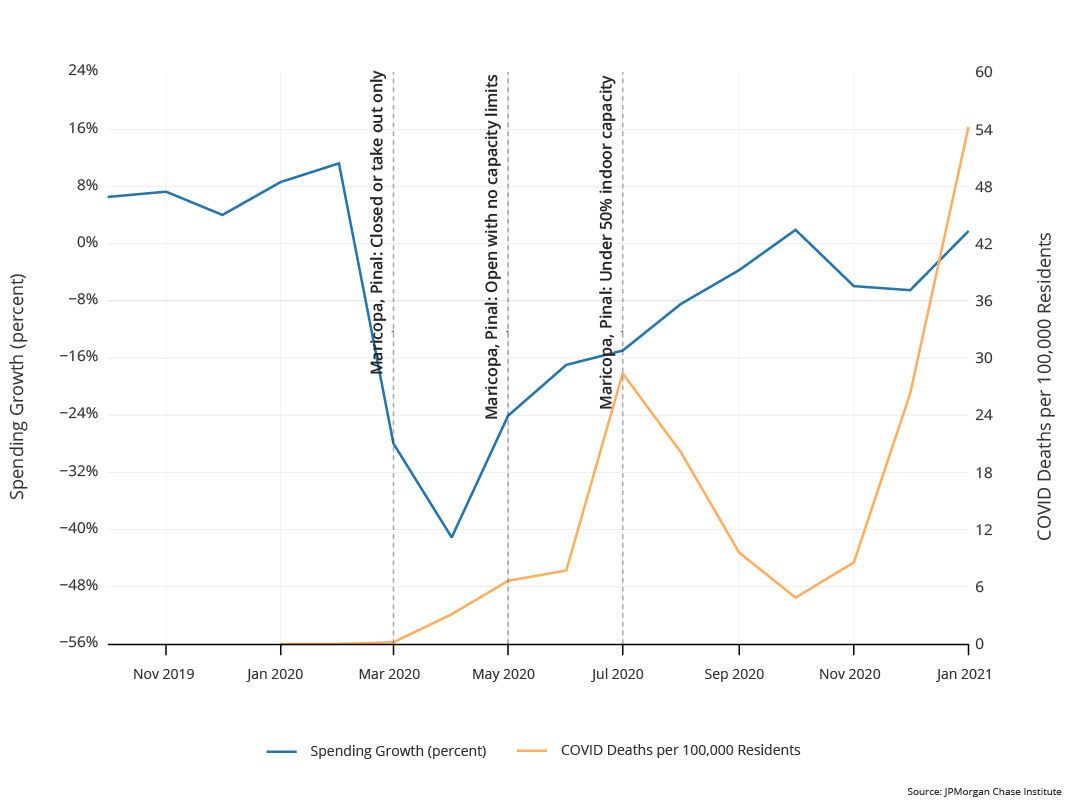
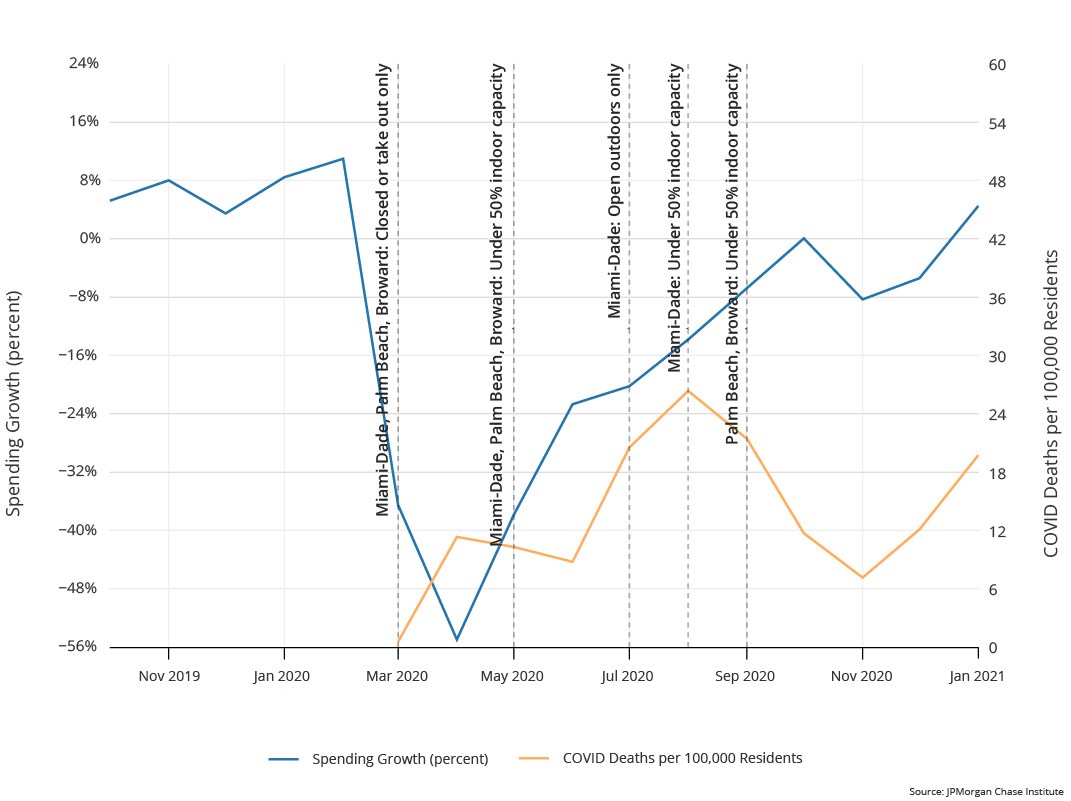
Figures 5c and 5d show two additional metro areas with similar restaurant spending growth trajectories and varying NPIs. The nadir of restaurant spending in Phoenix—approximately −40 percent in April 2020—was less severe than the declines in the other three featured cities despite similar restrictions in March. Restaurants in Phoenix reopened in May 2020 with no capacity limits, in contrast with the 50 percent indoor capacity limit in Miami. However, the change in restaurant spending growth from April to May in both metro areas was approximately 17 percentage points. Moreover, restaurant spending continued to recover despite, at times, more restrictive NPIs and increasing COVID death rates. Similar to Los Angeles and Seattle, the recovery in restaurant spending ceased in November 2020, even though Miami and Phoenix did not change their NPIs in the same way as Seattle and Los Angeles.
Figure 5c: NPIs are not associated with substantial changes in the trajectory of restaurant spending: Phoenix
Figure 5d: NPIs are not associated with substantial changes in the trajectory of restaurant spending: Miami
Other researchers have found both that shutdowns had a negligible effect on economic activity on top of voluntary changes in behavior and that there was not clear evidence that re-openings led to significant increases in economic activity (Goolsbee and Syverson 2020, Chen et al. 2020, and Chetty et al., 2020). Our findings reinforce this claim with more recent evidence on spending and related NPIs in a specific sector. On the other hand, when analyzed using more recent data, the relationship between economic activity and the severity of the COVID pandemic may be weaker than it was in the spring of 2020.
Implications
An initial examination of this novel data source reinforces the idea that while different parts of the country have experienced the tragic effects of the COVID-19 pandemic at different times and with different intensities, there is a common economic story of recovery in spending growth. As the local severity of the COVID pandemic is not a significant predictor of local spending growth, further research is needed to parse the local economic effects of broader trends, such as national conditions, our changing understanding of the virus, pandemic fatigue, and rapidly increasing numbers of vaccinated people. Similarly, while it is not obvious that NPIs are constraining spending growth for restaurants, there may be important inequality in businesses’ access to the tools that help spending recover. For example, online platforms and updated physical infrastructure may help businesses reach customers in new ways. However, both of these investments entail up-front and ongoing costs that not all business have the resources to cover. How local economies recover from the COVID pandemic will be shaped in part by these inequalities and the durability of the changes in spending by product and channel we observe during the pandemic. The JPMorgan Chase Institute will continue to research these areas and provide monthly updates to its Local Commerce Data Series, offering others a new source of data to inform local economic policy.
We thank Bryan Kim, Nich Tremper, Melissa O’Brien, and Lindsay Relihan for their hard work and contributions to this research. Additionally, we thank Sruthi Rao for her support. We are indebted to our internal partners and colleagues, who support delivery of our agenda in a myriad of ways, and acknowledge their contributions to each and all releases.
We would like to acknowledge Jamie Dimon, CEO of JPMorgan Chase & Co., for his vision and leadership in establishing the Institute and enabling the ongoing research agenda. We remain deeply grateful to Peter Scher, Head of Corporate Responsibility, Heather Higginbottom, President of the JPMC PolicyCenter, and others across the firm for the resources and support to pioneer a new approach to contribute to global economic analysis and insight.
Chen, Sophia, Deniz Igan, Nicola Pierri, and Andrea F Presbitero. 2020. “Tracking the Economic Impact of COVID-19 and Mitigation Policies in Europe and the United States.” Working paper. The International Monetary Fund, July 10. https://www.imf.org/en/Publications/WP/Issues/2020/07/10/Tracking-the-Economic-Impact-of-COVID-19-and-Mitigation-Policies-in-Europe-and-the-United-49553
Chetty, Raj, John N. Friedman, Nathaniel Hendren, Michael Stepner, and the Opportunity Insights Team. 2020. “Real-Time Economics: A New Platform to Track the Impacts of COVID-19 on People, Businesses, and Communities Using Private Sector Data.” Working paper. National Bureau of Economic Research. June. https://www.nber.org/papers/w27431
“COVID-19 and Related State Data,” KFF.org, Kaiser Family Foundation. Accessed April 1, 2021, https://www.kff.org/statedata/collection/covid-19-and-related-state-data/
“COVID-19: Local Action Tracker” NLC.org, National League of Cities/Bloomberg Philanthropies. Accessed April 1, 2021, https://www.nlc.org/resource/covid-19-local-action-tracker/
Goolsbee, Austan and Chad Syverson. 2021. “Fear, lockdown, and diversion: Comparing drivers of pandemic economic decline 2020.” Journal of Public Economics vol. 193. https://doi.org/10.1016/j.jpubeco.2020.104311
Kim, Olivia S., Jonathan A. Parker, Antoinette Schoar. 2020. “Revenue Collapses and the Consumption of Small Business Owners in the Early Stages of the COVID-19 Pandemic.” Working paper. National Bureau of Economic Research, November. https://www.nber.org/system/files/working_papers/w28151/w28151.pdf
Authors:
Chris Wheat, Co-President
Chi Mac, Research Lead
James Duguid, Research Associate
JPMorgan Chase & Co.'s website terms, privacy and security policies don't apply to the site or app you're about to visit. Please review its website terms, privacy and security policies to see how they apply to you. JPMorgan Chase & Co. isn't responsible for (and doesn't provide) any products, services or content at this third-party site or app, except for products and services that explicitly carry the JPMorgan Chase & Co.