We no longer support this browser. Using a supported browser will provide a better experience.
Please update your browser.
JPMorgan Chase Reports Fourth-Quarter 2013 Net Income of $5.3 Billion, or $1.30 Per Share, on Revenue1 of $24.1 Billion
New York
– January 14, 201414% Return on Tangible Common Equity1
Full-Year 2013 Net Income of $17.9 Billion, or $4.35 Per Share, on Revenue1 of $99.8 Billion
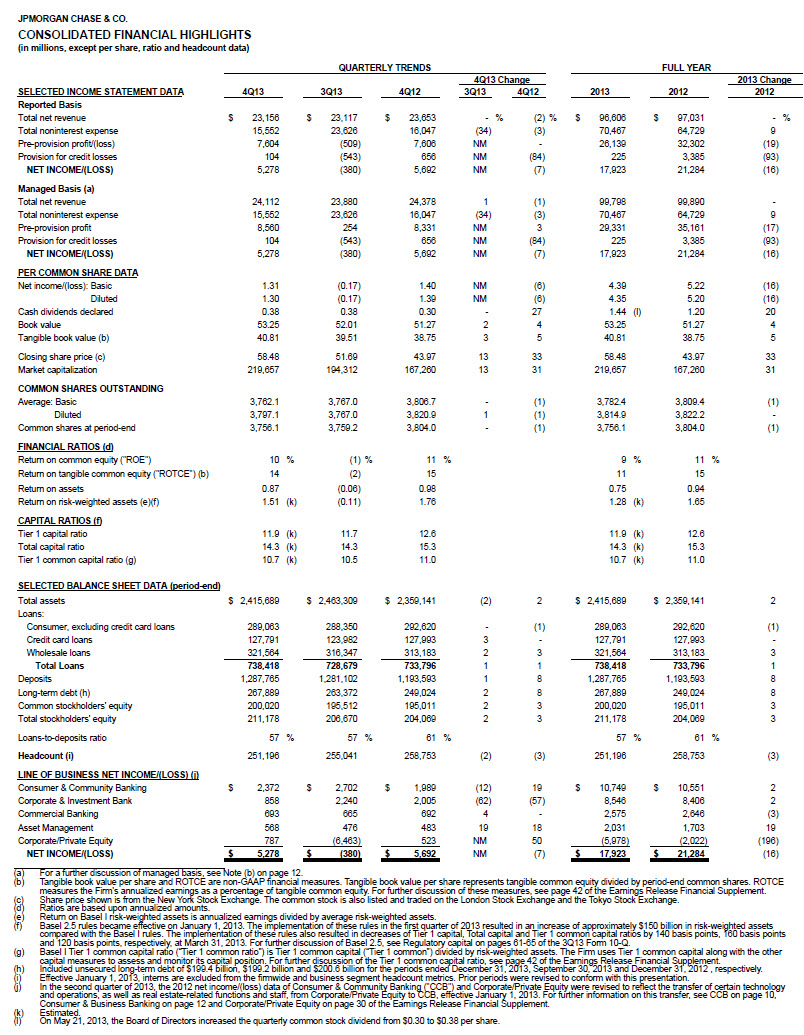
JPMorgan Chase & Co. (NYSE: JPM) today reported net income for the fourth quarter of 2013 of $5.3 billion, compared with net income of $5.7 billion in the fourth quarter of 2012. Earnings per share were $1.30, compared with $1.39 in the fourth quarter of 2012. Revenue for the quarter was $24.1 billion, down 1% compared with the prior year. The Firm's return on tangible common equity1 for the fourth quarter of 2013 was 14%, compared with 15% in the prior year.
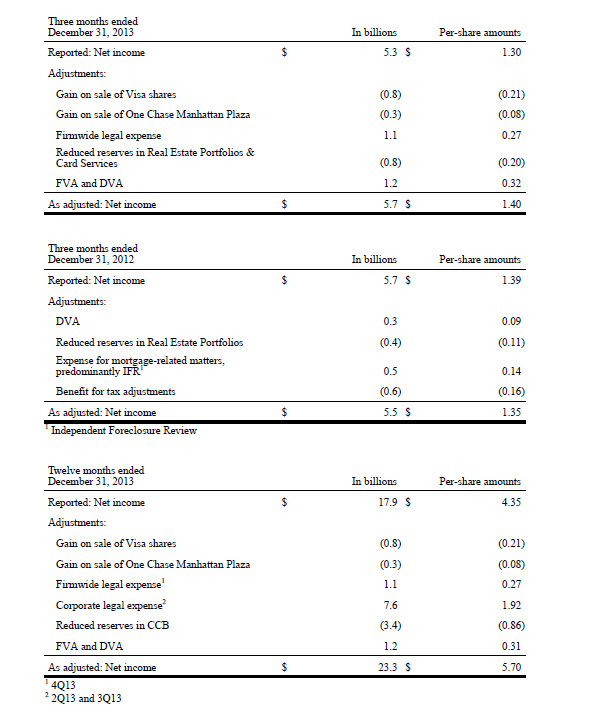
Adjusted for the significant items disclosed in our earnings press releases this quarter and in the fourth quarter of 2012, EPS would have been $1.40 this year compared with $1.35 in the prior year and ROTCE would have been 15% this year, flat compared with the prior year.
Net income for full-year 2013 was $17.9 billion, compared with $21.3 billion for the prior year. Earnings per share were $4.35 for 2013, compared with $5.20 for 2012. Revenue for 2013 was $99.8 billion, flat compared with 2012 revenue of $99.9 billion.
Jamie Dimon, Chairman and Chief Executive Officer, commented on the financial results: "We are pleased to have made progress on our control, regulatory and litigation agendas and to have put some significant issues behind us this quarter. We reached several important resolutions - Global RMBS, Gibbs & Bruns, and Madoff. It was in the best interests of our company and shareholders for us to accept responsibility, resolve these issues and move forward. This will allow us to focus on what we are here for: serving our clients and communities around the world. We remained focused on building our four leading franchises, which all continued to deliver strong underlying performance, for the quarter and the year."
Dimon continued, "The Corporate & Investment Bank was #1 in global IB fees in 2013, with #1 positions in global debt and equity, syndicated loans, and U.S. announced M&A, and we gained share in Banking and Markets. Consumer & Community Banking deposits were up 8% for the fourth quarter of 2013; client investment assets were up 19%; and general purpose credit card sales volume growth has outperformed the industry for 23 consecutive quarters. Gross investment banking revenue3 was a record $1.7 billion for the year, up 5%. Asset Management also had excellent performance with positive net long-term client flows of $90 billion for the full year 2013 and record loan balances, up 21%."
Dimon added: "During the course of 2013, JPMorgan Chase continued to make a significant positive impact on our communities. In 2013, the Firm provided credit and raised capital of over $2.1 trillion for our clients. The Firm has hired over 6,300 military veterans since 2011 as a proud founding member of the 100,000 Jobs Mission."
Dimon concluded: "I am proud of this Company, our employees and what we do every day to serve our clients, customers and communities. We are increasingly optimistic about the future of the U.S. economy and will continue to do our part to support growth, economic development and the creation of new jobs around the world."
In the discussion below of the business segments and of JPMorgan Chase as a Firm, information is presented on a managed basis. For more information about managed basis, as well as other non-GAAP financial measures used by management to evaluate the performance of each line of business, see pages 12 and 13. The following discussion compares the fourth quarters of 2013 and 2012 unless otherwise noted. Footnotes in the sections that follow are described on page 14.
| Results for CCB ($ millions) | 4Q13 | 3Q13 | 4Q12 | 3Q13 | 4Q12 | ||
|---|---|---|---|---|---|---|---|
| $ O/(U) | O/(U) % | $ O/(U) | O/(U) % | ||||
| Net Revenue | $ 11,314 | $ 11,082 | $ 12,362 | $ 232 | 2% | $ (1,048) | (8)% |
| Provision for Credit Losses | 72 | (267) | 1,091 | 339 | NM | (1,019) | (93) |
| Noninterest Expenses | 7,321 | 6,867 | 7,989 | 454 | 7 | (668) | (8) |
| Net Income | $ 2,372 | $ 2,702 | $ 1,989 | $ (330) | (12)% | $ 383 | 19% |
Discussion of Results:
Net income was $2.4 billion, an increase of $383 million, or 19%, compared with the prior year, due to lower provision for credit losses and lower noninterest expense, largely offset by lower net revenue.
Net revenue was $11.3 billion, a decrease of $1.0 billion, or 8%, compared with the prior year. Net interest income was $7.1 billion, down $199 million, or 3%, driven by spread compression in Credit Card, lower deposit margins and lower loan balances due to portfolio runoff, partially offset by higher deposit balances. Noninterest revenue was $4.3 billion, a decrease of $849 million, or 17%, driven by lower mortgage fees and related income, partially offset by higher investment sales revenue.
The provision for credit losses was $72 million, compared with $1.1 billion in the prior year and a benefit of $267 million in the prior quarter. The current-quarter provision reflected a $1.2 billion reduction in the allowance for loan losses and total net charge-offs of $1.3 billion. The prior-quarter provision reflected a $1.6 billion reduction in the allowance for loan losses and total net charge-offs of $1.3 billion. The prior-year provision reflected a $700 million reduction in the allowance for loan losses and total net charge-offs of $1.8 billion.
Noninterest expense was $7.3 billion, a decrease of $668 million, or 8%, from the prior year, driven by lower mortgage servicing expense, partially offset by higher non-MBS related legal expense in Mortgage Production and costs related to the control agenda.
Key Metrics and Business Updates:
(All comparisons refer to the prior-year quarter except as noted; banking portal ranking is per compete.com, as of November 2013)
Consumer & Business Banking net income was $780 million, an increase of $49 million, or 7%, compared with the prior year, due to higher net revenue, largely offset by higher noninterest expense.
Net revenue was $4.4 billion, up 4% compared with the prior year. Net interest income was $2.7 billion, up 3% compared with the prior year, driven by higher deposit balances, largely offset by lower deposit margins. Noninterest revenue was $1.7 billion, an increase of 4%, driven by higher investment sales revenue and debit card revenue, partially offset by lower deposit-related fees.
The provision for credit losses was $108 million, compared with $110 million in the prior year and $104 million in the prior quarter.
Noninterest expense was $3.0 billion, up 3% from the prior year, due to costs related to the control agenda.
Key Metrics and Business Updates:
(All comparisons refer to the prior-year quarter except as noted)
Mortgage Banking net income was $562 million, an increase of $144 million, or 34%, compared with the prior year, driven by lower noninterest expense and provision for credit losses, predominantly offset by lower net revenue.
Net revenue was $2.2 billion, a decrease of $1.1 billion compared with the prior year. Net interest income was $1.1 billion, a decrease of $58 million, or 5%, driven by lower loan balances due to portfolio runoff. Noninterest revenue was $1.1 billion, a decrease of $1.0 billion, driven by lower mortgage fees and related income.
The provision for credit losses was a benefit of $782 million2, compared with a benefit of $269 million in the prior year. The current quarter reflected a $950 million reduction in the allowance for loan losses due to continued improvement in delinquencies and home prices. The prior year included a $700 million reduction in the allowance for loan losses. Net charge-offs were $168 million, compared with $431 million in the prior year.
Noninterest expense was $2.1 billion, a decrease of $809 million, or 28%, from the prior year, due to lower servicing expense.
Mortgage Production retax loss was $274 million, a decrease of $1.1 billion from the prior year, reflecting lower volumes, lower margins and higher legal expense, partially offset by lower repurchase losses. Mortgage production-related revenue, excluding repurchase losses, was $494 million, a decrease of $1.1 billion, or 69%, from the prior year, largely reflecting lower volumes and lower margins. Production expense2 was $989 million, an increase of $113 million from the prior year, due to higher non-MBS related legal expense, partially offset by lower compensation-related expense. Repurchase losses for the current quarter reflected a benefit of $221 million, compared with a benefit of $53 million in the prior year and a benefit of $175 million in the prior quarter. The current quarter reflected a $1.2 billion reduction in repurchase liability primarily as a result of the settlement with the GSEs for claims associated with loans sold to the GSEs from 2000 to 2008, compared with a $249 million reduction in repurchase liability in the prior year and a $300 million reduction in repurchase liability in the prior quarter.
Mortgage Servicing pretax income was $2 million, compared with a pretax loss of $913 million in the prior year, reflecting lower expense and higher revenue. Mortgage net servicing-related revenue was $689 million, an increase of $71 million. MSR risk management was a loss of $24 million, compared with income of $42 million in the prior year. Servicing expense was $663 million, a decrease of $910 million from the prior year, reflecting lower costs associated with the Independent Foreclosure Review and lower servicing headcount.
Key Metrics and Business Updates:
(All comparisons refer to the prior-year quarter except as noted)
Real Estate Portfolios pretax income was $1.2 billion, up $410 million from the prior year, due to a higher benefit from the provision for credit losses, partially offset by lower net revenue.
Net revenue was $850 million, a decrease of $115 million, or 12%, from the prior year. This decrease was due to lower noninterest revenue due to higher loan retention and lower net interest income resulting from lower loan balances due to portfolio runoff.
The provision for credit losses was a benefit of $783 million, compared with a benefit of $283 million in the prior year. The current-quarter provision reflected a $950 million reduction in the allowance for loan losses, $750 million from the purchased credit-impaired allowance and $200 million from the non credit-impaired allowance, reflecting continued improvement in delinquencies and home prices. The prior-year provision included a $700 million reduction in the allowance for loan losses from the non credit-impaired allowance. Net charge-offs were $167 million, compared with $417 million in the prior year. Home equity net charge-offs were $179 million (1.21% net charge-off rate1), compared with $257 million (1.49% net charge-off rate1) in the prior year. Subprime mortgage net recoveries were $6 million (0.33% net recovery rate1), compared with net charge-offs of $92 million (4.35% net charge-off ratee1). Net recoveries of prime mortgage, including option ARMs, were $8 million (0.06% net recovery ratee1), compared with net charge-offs of $66 million (0.63% net charge-off ratee1).
Noninterest expense was $411 million, a decrease of $25 million, or 6%, compared with the prior year.
Key Metrics and Business Updates:
(All comparisons refer to the prior-year quarter except as noted. Average loans include PCI loans)
Card, Merchant Services & Auto net income was $1.0 billion, an increase of $190 million, or 23%, compared with the prior year, driven by lower provision for credit losses, partially offset by lower net revenue.
Net revenue was $4.7 billion, down $140 million, or 3%, compared with the prior year. Net interest income was $3.3 billion, down $222 million compared with the prior year, primarily driven by spread compression in Credit Card. Noninterest revenue was $1.4 billion, up $82 million compared with the prior year, primarily driven by higher net interchange income, auto lease income and merchant servicing revenue, partially offset by lower revenue from an exited non-core product.
The provision for credit losses was $746 million, compared with $1.3 billion in the prior year and $673 million in the prior quarter. The current-quarter provision reflected lower net charge-offs and a $300 million reduction in the allowance for loan losses reflecting improved delinquency trends and a decrease in restructured loan volume.
The Credit Card net charge-off ratee1 was 2.85%, down from 3.50% in the prior year and 2.86% in the prior quarter; the 30+ day delinquency rate1 was 1.67%, down from 2.10% in the prior year and 1.68% in the prior quarter. The Auto net charge-off rate was 0.39%, up from 0.36% in the prior year and 0.35% in the prior quarter.
Noninterest expense was $2.2 billion, up $59 million, or 3% from the prior year, driven by higher marketing expense, payments to customers required by a regulatory consent order and higher auto lease depreciation, predominantly offset by the write-off of intangible assets in the prior year.
Key Metrics and Business Updates:
(All comparisons refer to the prior-year quarter except as noted)
| Results for CIB ($ millions) | 4Q13 | 3Q13 | 4Q12 | 3Q13 | 4Q12 | ||
|---|---|---|---|---|---|---|---|
| $ O/(U) | O/(U) % | $ O/(U) | O/(U) % | ||||
| Net Revenue | $ 6,020 | $ 8,189 | $ 7,642 | $ (2,169) | (26)% | $ (1,622) | (21)% |
| Provision for Credit Losses | (19) | (218) | (445) | 199 | 91 | 426 | 96 |
| Noninterest Expenses | 4,892 | 4,999 | 4,996 | (107) | (2) | (104) | (2) |
| Net Income | $ 858 | $ 2,240 | $ 2,005 | $ (1,382) | (62)% | $ (1,147) | (57)% |
Discussion of Results:
Net income was $858 million, down 57% compared with the prior year. These results primarily reflected lower revenue and a lower benefit from the provision for credit losses, partially offset by slightly lower noninterest expense. Net revenue was $6.0 billion compared with $7.6 billion in the prior year. Net revenue included a $1.5 billion loss as a result of implementing a funding valuation adjustment1 ("FVA") framework for OTC derivatives and structured notes. This change reflects an industry migration towards incorporating the cost or benefit of funding into their valuation; the majority of this adjustment relates to uncollateralized derivatives. Net revenue also included a $536 million loss from debit valuation adjustments1 ("DVA") on structured notes and derivative liabilities, compared with a loss from DVA of $567 million in the prior year. Excluding the impact of both FVA1 and DVA1, net income was $2.1 billion, down 11% compared with the prior year, and net revenue was $8.0 billion, down 2% compared with the prior year.
Banking revenue was $3.0 billion, down 4% from the prior year. Investment banking fees were $1.7 billion, down 3% from the prior year, driven by lower debt underwriting fees of $801 million, down 19% from a record prior year, and by lower advisory fees of $434 million, down 7% from the prior year. This was predominantly offset by higher equity underwriting fees of $436 million, up 65% from the prior year, on strong market issuance and improved market share. Treasury Services revenue was $1.0 billion, down 7% compared with the prior year, driven by lower trade finance revenue. Lending revenue was $373 million, primarily reflecting net interest income on retained loans, fees on lending-related commitments, and gains on securities received from restructured loans.
Markets & Investor Services revenue was $3.0 billion, down 33% from the prior year. Combined Fixed Income and Equity Markets revenue was $4.1 billion, flat compared with the prior year. In the prior year, Fixed Income Markets also included a modest loss from the synthetic credit portfolio. Securities Services revenue was $1.0 billion, up 3% from the prior year, primarily driven by higher custody and fund services revenue, due largely to higher assets under custody and higher deposits. Credit Adjustments & Other revenue was a loss of $2.1 billion, driven by the impact of both FVA1 and DVA1, compared with a loss of $586 million in the prior year, predominantly driven by DVA1.
The provision for credit losses was a benefit of $19 million, compared with a benefit of $445 million in the prior year. The prior year included recoveries and a reduction in the allowance for credit losses, both related to certain restructured nonperforming loans. The ratio of the allowance for loan losses to period-end loans retained was 1.15%, compared with 1.19% in the prior year. Excluding the impact of the consolidation of Firm-administered multi-seller conduits and trade finance loans, the ratio of the allowance for loan losses to period-end loans retained1 was 2.02%, compared with 2.52% in the prior year.
Noninterest expense was $4.9 billion, down 2% from the prior year, primarily due to lower compensation expense. The compensation ratio was 27%, excluding the impact of FVA1 and DVA1.
Key Metrics and Business Updates:
(All comparisons refer to the prior-year quarter except as noted, and all rankings are according to Dealogic)
| Results for CB ($ millions) | 4Q13 | 4Q13 | 4Q12 | 3Q13 | 4Q12 | ||
|---|---|---|---|---|---|---|---|
| $ O/(U) | O/(U) % | $ O/(U) | O/(U) % | ||||
| Net Revenue | $ 1,847 | $ 1,725 | $ 1,745 | $ 122 | 7% | $ 102 | 6% |
| Provision for Credit Losses | 43 | (41) | (3) | 84 | NM | 46 | NM |
| Noninterest Expenses | 653 | 661 | 599 | (8) | (1) | 54 | 9 |
| Net Income | $ 693 | $ 665 | $ 692 | $ 28 | 4% | $ 1 | - |
Discussion of Results:
Net income was $693 million, flat compared with the prior year, reflecting an increase in noninterest expense and a higher provision for credit losses, offset by higher net revenue.
Net revenue was $1.8 billion, an increase of $102 million, or 6%, compared with the prior year. Net interest income was $1.2 billion, an increase of $56 million, or 5%, compared with the prior year, reflecting the one-time proceeds from a lending-related workout and higher loan and liability balances, partially offset by loan spread compression and lower purchase discounts recognized on loan repayments. Noninterest revenue was $624 million, an increase of $46 million, or 8%, compared with the prior year, reflecting higher community development-related revenue.
Revenue from Middle Market Banking was $744 million, flat compared with the prior year. Revenue from Corporate Client Banking was $488 million, flat compared with the prior year. Revenue from Commercial Term Lending was $298 million, a decrease of $14 million, or 4%, compared with the prior year. Revenue from Real Estate Banking was $206 million, an increase of $93 million, or 82%, compared with the prior year, driven by the one-time proceeds from a lending-related workout.
The provision for credit losses was $43 million, compared with a benefit of $3 million in the prior year. Net charge-offs were $25 million (0.07% net charge-off rate), compared with net charge-offs of $50 million (0.16% net charge-off rate) in the prior year and net charge-offs of $16 million (0.05% net charge-off rate) in the prior quarter. The allowance for loan losses to period-end loans retained was 1.97%, down from 2.06% in the prior year and down from 1.99% in the prior quarter. Nonaccrual loans were $514 million, down $159 million, or 24%, from the prior year, and down by $52 million, or 9%, from the prior quarter.
Noninterest expense was $653 million, up 9% compared with the prior year, reflecting higher product- and headcount-related2 expense.
Key Metrics and Business Updates:
(All comparisons refer to the prior-year quarter except as noted)
| Results for AM ($ millions) | 4Q13 | 3Q13 | 4Q12 | 4Q13 | 4Q12 | ||
|---|---|---|---|---|---|---|---|
| $ O/(U) | O/(U) % | $ O/(U) | O/(U) % | ||||
| Net Revenue | $ 3,719 | $ 2,763 | $ 2,753 | $ 416 | 15% | $ 426 | 15% |
| Provision for Credit Losses | 21 | - | 19 | 21 | NM | 2 | 11 |
| Noninterest Expenses | 2,245 | 2,003 | 1,943 | 242 | 12 | 302 | 16 |
| Net Income | $ 568 | $ 476 | $ 483 | $ 92 | 19% | $ 85 | 18% |
Discussion of Results:
Net income was $568 million, an increase of $85 million, or 18%, from the prior year, reflecting higher net revenue, largely offset by higher noninterest expense.
Net revenue was $3.2 billion, an increase of $426 million, or 15%, from the prior year. Noninterest revenue was $2.6 billion, up $393 million, or 18%, from the prior year, due to net client inflows, higher valuations of seed capital investments and the effect of higher market levels. Net interest income was $585 million, up $33 million, or 6%, from the prior year, due to higher loan and deposit balances, partially offset by narrower loan spreads.
Revenue from Private Banking was $1.6 billion, up 11% compared with the prior year. Revenue from Institutional was $806 million, up 11%. Retail was $770 million, up 32%.
Client assets were $2.3 trillion, an increase of $248 billion, or 12%, compared with the prior year. Assets under management were $1.6 trillion, an increase of $172 billion, or 12%, from the prior year, due to net inflows to long-term products and the effect of higher market levels. Custody, brokerage, administration and deposit balances were $745 billion, up $76 billion, or 11%, from the prior year, due to the effect of higher market levels and custody inflows, partially offset by brokerage outflows.
The provision for credit losses was $21 million, compared with $19 million in the prior year.
Noninterest expense was $2.2 billion, an increase of $302 million, or 16%, from the prior year, primarily due to higher performance-based compensation, higher headcount-related2 expense and costs related to the control agenda.
Key Metrics and Business Updates:
(All comparisons refer to the prior-year quarter except as noted)
| Results for Corporate/Private Equity ($ millions) | 4Q13 | 3Q13 | 4Q12 | 3Q13 | 4Q12 | ||
|---|---|---|---|---|---|---|---|
| $ O/(U) | O/(U) % | $ O/(U) | O/(U) % | ||||
| Net Revenue | $ 1,752 | $ 121 | $ (124) | $ 1,631 | NM | $ 1,876 | NM |
| Provision for Credit Losses | (13) | (17) | (6) | 4 | 24 | (7) | (117) |
| Noninterest Expenses | 441 | 9,096 | 520 | (8,655) | (95) | (79) | (15) |
| Net Income | $ 787 | $ (6,463) | $ 523 | $ 7,250 | NM | $ 264 | 50% |
Discussion of Results:
Net income was $787 million, compared with net income of $523 million in the prior year.
Private Equity reported net income of $13 million, compared with net income of $50 million in the prior year. Net revenue was $57 million, compared with net revenue of $72 million in the prior year.
Treasury and CIO reported a net loss of $78 million, compared with a net loss of $157 million in the prior year. Net revenue was a loss of $25 million, compared with a loss of $110 million in the prior year. Current-quarter net interest income was a loss of $96 million reflecting the benefit of higher interest rates and reinvestment opportunities.
Other Corporate reported net income of $852 million, compared with net income of $630 million in the prior year. The current quarter included a $1.3 billion gain on the sale of Visa shares and a $0.5 billion gain on the sale of One Chase Manhattan Plaza. The current quarter also included approximately $0.4 billion of pretax legal expense ($0.8 billion after-tax) compared with $0.2 billion of pretax legal expense ($0.1 billion after-tax) in the prior year, and a benefit of $0.3 billion for tax adjustments compared to $0.6 billion in the prior year.
| Results for JPM ($ millions) | 4Q13 | 3Q13 | 4Q12 | 3Q13 | 4Q12 | ||
|---|---|---|---|---|---|---|---|
| $ O/(U) | O/(U) % | $ O/(U) | O/(U) % | ||||
| Net Revenue | $ 24,112 | $ 23,880 | $ 24,378 | $ 232 | 1% | $ (266) | (1)% |
| Provision for Credit Losses | 104 | (543) | 656 | 647 | NM | (552) | (84) |
| Noninterest Expenses | 15,552 | 23,626 | 16,047 | (8,074) | (34) | (495) | (3) |
| Net Income | $ 5,278 | $ (308) | $ 5,692 | $ 5,658 | NM | $ (414) | (79)% |
(*)Presented on a managed basis. See note on page 12 and 13 for further explanation of managed basis. Net revenue on a U.S. GAAP basis totaled $23,156 million, $23,117 million, and $23,653 million for the fourth quarter of 2013, forth quarter of 2013, and fourth quarter of 2012, respectively.
Discussion of Results:
Net income was $5.3 billion, down $414 million from the prior year. The decrease was driven by lower net revenue and higher taxes resulting from non-deductible penalties incurred and a lower benefit related to tax adjustments, which were partially offset by lower provision for credit losses and lower noninterest expense.
Net revenue was $24.1 billion, down $266 million, or 1%, compared with the prior year. Noninterest revenue was $13.0 billion, flat compared with the prior year. The current-quarter included a $1.5 billion loss as a result of implementing a funding valuation adjustment1 ("FVA") framework for OTC derivatives and structured notes, and a $536 million loss from debit valuation adjustmentssup1 ("DVA") on structured notes and derivative liabilities. Net interest income was $11.1 billion, down $203 million, or 2%, compared with the prior year, reflecting the impact of lower loan yields and lower trading and investment securities balances, partially offset by higher investment securities yields and lower financing costs.
The provision for credit losses was $104 million, down $552 million from the prior year. The total consumer provision for credit losses was $65 million, compared with $1.1 billion in the prior year. The current-quarter provision reflected a $1.2 billion reduction in the allowance for loan losses, compared to a $700 million reduction in the prior year, due to favorable delinquency trends and lower estimated losses in mortgage and credit card portfolios. Consumer net charge-offs were $1.3 billion, compared with $1.8 billion in the prior year, resulting in net charge-off rates of 1.44% and 1.99%, respectively. The decrease in consumer net charge-offs was primarily due to improved delinquency trends. The wholesale provision for credit losses was an expense of $39 million, compared with a benefit of $430 million in the prior year. Wholesale net charge-offs were $22 million, compared with net recoveries of $158 million in the prior year, resulting in a net charge-off rate of 0.03% and a net recovery rate of 0.21%, respectively. The Firm's allowance for loan losses to period-end loans retainedsup>1 was 1.80%, compared with 2.43% in the prior year. The Firm's nonperforming assets totaled $9.7 billion, down from the prior quarter and prior year levels of $10.4 billion and $11.9 billion, respectively.
Noninterest expense was $15.6 billion, down $495 million, or 3%, compared with the prior year, primarily driven by lower servicing expense. The current quarter included approximately $847 million of legal expense, compared with $1.2 billion of legal expense in the prior year.
Key Metrics and Business Updates:
(All comparisons refer to the prior-year quarter except as noted)
1. Notes on non-GAAP financial measures:
2. Additional notes on financial measures:
JPMorgan Chase & Co. (NYSE: JPM) is a leading global financial services firm with assets of $2.4 trillion and operations worldwide. The Firm is a leader in investment banking, financial services for consumers and small businesses, commercial banking, financial transaction processing, asset management and private equity. A component of the Dow Jones Industrial Average, JPMorgan Chase & Co. serves millions of consumers in the United States and many of the world's most prominent corporate, institutional and government clients under its J.P. Morgan and Chase brands. Information about JPMorgan Chase & Co. is available at www.jpmorganchase.com.
JPMorgan Chase & Co. will host a conference call today at 8:30 a.m. (Eastern Time) to present fourth-quarter financial results. The general public can access the call by dialing (866) 541-2724 or (866) 786-8836 in the U.S. and Canada, or (706) 634-7246 for international participants. Please dial in 10 minutes prior to the start of the call. The live audio webcast and presentation slides will be available on the Firm's website, www.jpmorganchase.com, under Investor Relations, Investor Presentations.
A replay of the conference call will be available beginning at approximately noon on January 14, 2014 through midnight, January 28, 2013 by telephone at (855) 859-2056 or (800) 585-8367 (U.S. and Canada) or (404) 537-3406 (international); use Conference ID# 15872405. The replay will also be available via webcast on www.jpmorganchase.com under Investor Relations, Investor Presentations. Additional detailed financial, statistical and business-related information is included in a financial supplement. The earnings release and the financial supplement are available at www.jpmorganchase.com.
This earnings release contains forward-looking statements within the meaning of the Private Securities Litigation Reform Act of 1995. These statements are based on the current beliefs and expectations of JPMorgan Chase & Co.'s management and are subject to significant risks and uncertainties. Actual results may differ from those set forth in the forward-looking statements. Factors that could cause JPMorgan Chase & Co.'s actual results to differ materially from those described in the forward-looking statements can be found in JPMorgan Chase & Co.'s Annual Report on Form 10-K for the year ended December 31, 2012 and Quarterly Report on Form 10-Q for the quarters ended March 31, 2013, June 30, 2013, and September 30, 2013, which have been filed with the Securities and Exchange Commission and are available on JPMorgan Chase & Co.'s website (http://investor.shareholder.com/jpmorganchase) and on the Securities and Exchange Commission's website (www.sec.gov). JPMorgan Chase & Co. does not undertake to update the forward-looking statements to reflect the impact of circumstances or events that may arise after the date of the forward-looking statements.

Sign up for updates on the ways we are using our expertise, data, resources and scale to open new pathways to economic opportunity and drive inclusive growth in communities around the world.
For help as a customer or client:
For shareholder and fixed income assistance, including requests for printed materials, please contact
Investor Relations
JPMorgan Chase & Co.
277 Park Avenue
New York, NY 10172-0003
212-270-2479
JPMCinvestorrelations@jpmchase.com
For ADA-related inquiries, please contact
JPMCinvestorrelations@jpmchase.com with the subject line “ADA inquiry”
Stock Transfer Agent:
Computershare
By Regular Mail
Computershare
PO Box 43006
Providence, RI 02940-3006
By overnight delivery:
Computershare
150 Royall Street
Suite 101
Canton, MA 02021
800-758-4651 (toll free)
201-680-6862 (international)
www.computershare.com