We no longer support this browser. Using a supported browser will provide a better experience.
Please update your browser.
About one in five U.S. workers received unemployment insurance benefits in June 2020, which is five times greater than the highest UI recipiency rate previously recorded. Yet little is known about how unemployment benefits are affecting the economy today. To fill this gap, we study the consumption of benefit recipients during the pandemic.
In normal times, spending among unemployment benefit recipients falls by about seven percent in response to unemployment because typical benefits replace only a fraction of lost earnings. However, in March 2020, the Coronavirus Aid, Relief, and Economic Security (CARES) Act added a $600 weekly supplement to state unemployment benefits, replacing lost earnings by more than 100 percent for two-thirds of unemployed workers eligible, by some estimates. As a result, for benefit spells which begin after workers receive this supplement, we find dramatically different spending patterns for the unemployed compared to normal times. Although average spending fell for all households as the economy shut down at the start of the pandemic, we find that unemployed households actually increased their spending beyond pre-unemployment levels once they began receiving benefits. The fact that spending by benefit recipients rose during the pandemic instead of falling, like in normal times, suggests that the $600 supplement has helped households to smooth consumption and stabilized aggregate demand.
We also examine spending patterns of the unemployed while waiting for benefits to arrive. Households that receive benefits soon after job loss show no relative decline in spending, while households that wait two months to receive benefits due to processing delays have large spending declines. Compared to the employed, spending falls by 20 percent prior to receiving benefits. This suggests that delays have imposed substantial hardship on benefit recipients.
The $600 supplement to unemployment insurance benefits is scheduled to expire at the end of July. Our estimates suggest that expiration will result in large spending cuts, with potentially negative effects on both households and macroeconomic activity. The estimates also provide a guide to projecting the economic consequences of alternative supplement levels. Finally, our results also underscore the importance of making unemployment benefits broadly available and bolstering states’ ability to process claims promptly.
Finding 1: While aggregate spending of the employed was down by 10 percent during the initial months of the pandemic, the spending of unemployment benefit recipients increased 10 percent, a pattern which is likely explained by the $600 federal weekly benefit supplement.
Finding 2: Among the unemployed who experience a substantial delay in receiving benefits, spending falls by 20 percent.
As families and individuals grapple with the financial impact of the Covid-19 pandemic, unemployment insurance (UI) benefits are playing a more important role in the U.S. economy than ever before. In normal times, UI benefits represent just 1 percent of total wages. During the Great Recession, the UI system expanded to pay out benefits equal to 2.5 percent of wages. In May 2020, total benefits were equal to 14.6 percent of total wages, which is more than five times the Great Recession peak.[1]
Three forces are at play in causing UI to play this outsized role in our economy. First, many workers lost their jobs all at once, resulting in an unprecedented rise in the number of regular UI claims. Second, the Coronavirus Aid, Relief, and Economic Security (CARES) Act, enacted by the federal government in March 2020, created the Pandemic Unemployment Assistance program which expanded UI benefits to many jobless workers who were previously ineligible for UI, including self-employed workers, independent contractors, and gig workers. This means more workers are eligible to receive UI. Third, the CARES Act also added a $600 weekly supplement to the amount of state UI benefits, known as the Federal Pandemic Unemployment Compensation (FPUC) program. This increased the level of UI benefits. Researchers estimate that as a result roughly two-thirds of unemployed workers are eligible for UI benefits that exceed their wages (Ganong, Noel, and Vavra 2020).
Given the new centrality of unemployment insurance in the U.S. economy, it is imperative to understand its economic effects. Research has demonstrated that in normal times, spending among UI recipients falls by about 7 percent in response to unemployment because typical UI benefits replace only a fraction of lost earnings (Ganong and Noel 2019). However, data limitations mean that there is virtually no research yet studying the effect of UI on individual households and the economy more broadly during the pandemic. Household survey datasets that measure the role of UI are years away from being released, and more contemporaneous private sector datasets used by other researchers during the pandemic mix measures of the unemployed and employed. Thus, this report provides the first estimates for consumption specifically of unemployed households during the pandemic.
Unemployment benefits play an important role in providing individual insurance and helping households maintain consumption during unemployment. UI benefits also play an important role as automatic stabilizers which provide macroeconomic stimulus during recessions. Even with no changes in policy, such as those made through the CARES Act, aggregate government transfers through unemployment insurance rise with the level of aggregate unemployment. Since UI recipients have a high marginal propensity to consume (MPC), this can in turn help stabilize aggregate demand. Because total UI transfers are now five-times larger than during previous recessions, the current potential effects of UI on aggregate demand far exceed the effects in those prior recessions.
We explore the effects of UI during the pandemic by measuring the consumption of UI recipients relative to their pre-unemployment baseline levels and also relative to their consumption immediately before the start of benefits. In normal times, delays between the start of unemployment and the start of UI benefits are usually minimal, but anecdotal evidence suggests claimants have experienced delays in receiving benefits due to the sheer volume of claims and potential for fraud during the pandemic. Examining changes in income and consumption prior to UI receipt allows us to explore the extent and welfare consequences of such delays. Comparing to consumption after UI benefits begin allows us to understand the role of benefits in stabilizing household balance sheets and boosting aggregate demand once they are received.
Our key findings are twofold. Our first finding is that during the pandemic, while aggregate spending of the employed was down by 10 percent, the spending of unemployment benefit recipients increased by 10 percent, a pattern which is likely explained by the $600 federal weekly supplement. At the same time, our second finding is that among the unemployed who experience a substantial delay in receiving benefits, spending falls by 20 percent—a drop not seen by those who receive benefits more immediately after job loss. Thus, receiving unemployment insurance is an effective means of insuring the unemployed against welfare losses associated with job loss when delivered timely. With the $600 federal benefit supplement through the FPUC program, UI has not only helped unemployed households to smooth consumption but has also helped to stabilize aggregate demand.
We examine a sample of six million households who are regular users of their Chase deposit accounts insofar as they have at least five transactions every month between January 2018 and March 2020 and at least $12,000 of observed labor income in both 2018 and 2019. Our primary measure of spending is account outflows, which are an upper bound on spending because they can include transfers to other bank accounts. In future research, we plan to analyze more granular spending metrics, including spend on debit cards, credit cards, and across categories of consumption.
In this insight, we examine the spending response of approximately 73,000 households who received direct-deposited UI benefits into their Chase accounts during the Covid-19 pandemic, through the end of May 2020. In order to focus on households who have received UI benefits consistently during the Covid-19 period, we restrict our analysis to households in ten states that pay UI benefits on a weekly basis and where Chase has had a branch presence since at least 2017 (see Table 1). In Finding 1, we examine a sample of unemployed households made up of households who began receiving UI benefits in late March or April of 2020 and who continued to receive benefits through the end of May (“continuous UI benefit recipients sample”). We compare this sample with a sample of “employed households” that do not receive UI benefits in 2020.[2] In Finding 2, we compare the spending response of three cohorts of unemployed households, all of which experienced job loss in late April but began receiving benefits at different times in March, April, or May. This “definitive job losers sample” enables us to examine the impacts of delayed benefit receipt. Table 1 provides further details about these samples.
Name of sample |
Number of Chase customer households |
Sample definition |
Continuous UI benefit recipients sample |
61,307 |
Chase core deposit customers (have at least five deposit transactions every month of January 2018 through March 2020 and at least $12,000 observed labor income in both 2018 and 2019) who meet the following filters: ·Live in one of ten states that pay UI benefits on a weekly basis.* ·At least one Chase account transaction in at least 17 of the 21 weeks from Jan. 5, 2020 through May 30, 2020. ·Receive first UI benefit of 2020 in one of the following four weeks: week of Mar. 29, Apr. 5, Apr. 12, or Apr. 19. · Customer must receive UI benefits in every week from their first UI week through the week of May 24, 2020. |
Employed sample |
114,222 (random sample of about 5.5 million total) |
Chase core deposit customers who do not receive any direct-deposited UI benefits during January through May 2020. |
Definitive job losers sample
|
19,708 |
Chase core deposit customers who meet the following filters: · Live in one of ten states that pay UI benefits on a weekly basis (see text for details). · Receive first UI benefit in 2020 in one of the following three weeks: week of Mar. 29, Apr. 26, or May 24. · Customer experienced job loss, as inferred by the following criteria: customer had positive observed labor income in at least one of the weeks of Mar. 1, Mar. 8, or Mar. 15, and had zero observed labor income in all of the weeks of Apr. 19, Apr. 26, and May 3. |
* These states are Arizona, Georgia, Idaho, Indiana, New Jersey, New York, Oregon, Washington, West Virginia, and Wisconsin. |
||
One important distinction between our data and the national population of UI recipients is that we only observe households receiving UI via direct deposit. Data from the Federal Reserve show that the bulk of unemployment benefits nationally are paid via prepaid debit card, which we do not observe (Federal Reserve Board, 2019). The households in our sample, who are Chase bank account holders that have had relatively stable income over the 2018 to 2019 period, are likely less financially vulnerable on average than UI recipients nationally, who include unbanked individuals and individuals with highly volatile incomes. This suggests that our results likely understate the role of unemployment insurance in smoothing consumption, as we do not capture the households whose spending tends to respond most strongly to changes in cash flow.
The goal of this insight is to examine spending around UI benefit receipt and understand how the pandemic has affected the relationship between unemployment and spending. Answering this question requires addressing two technical challenges that make it particularly difficult to study unemployment spells starting in April 2020. First, spending levels from week to week are, in general, quite volatile, so it can be difficult to separate out the impacts of UI from typical volatility in spending. Second, the entire U.S. economy experienced a massive aggregate spending decline in the spring of 2020 (Cox et al. 2020). That said, these two challenges introduce two potentially relevant benchmarks—the pre-unemployment spending levels of UI recipients and the now-depressed spending levels of everyone else. To address these two concerns, we study the year-over-year change in spending and compare those who received UI during the pandemic to a group of those who remained employed. This eliminates most week-to-week volatility in spending and capture how spending during Covid-19 differs from its pre-pandemic period trend (Figures A1 and A2 in the Appendix).[3]
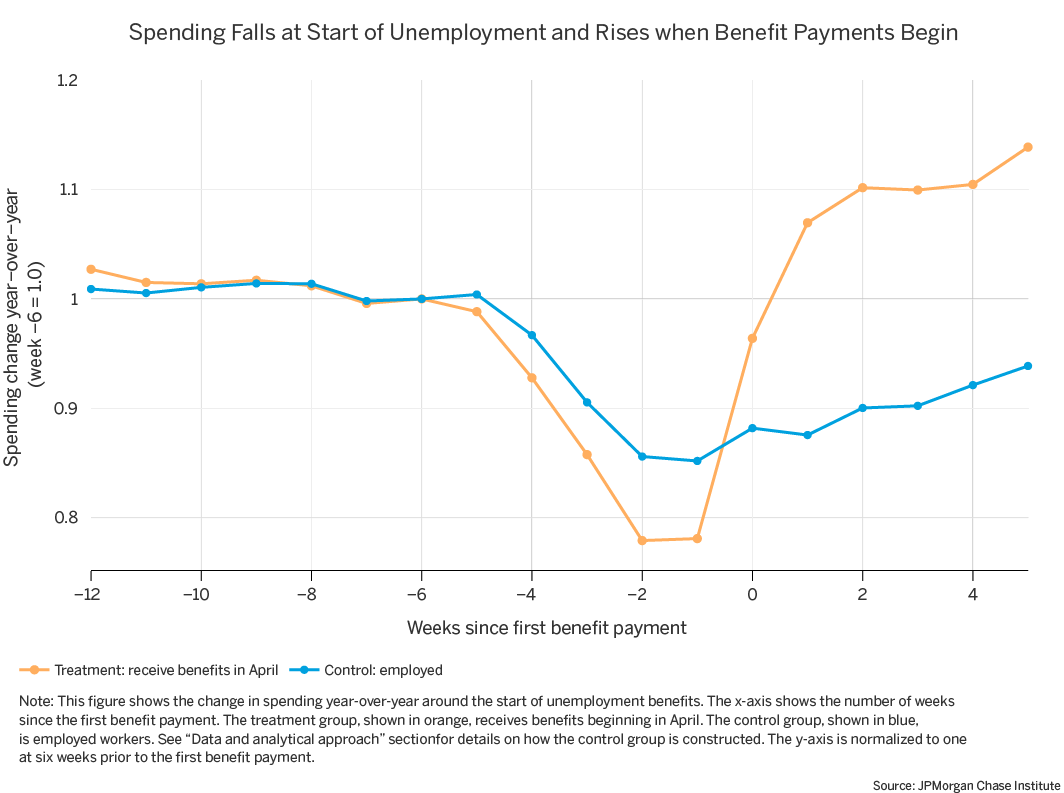
Recognizing that workers lost their jobs and received UI at different times over the course of the spring of 2020, we compare the path of spending for benefit recipients and employed relative to the date of first UI payment, rather than in calendar time (e.g. Figure 1).[4] This enables us to use a single series to depict spending for UI spells that begin on different dates. Including all UI spells across our time studied has two benefits: it smooths out some of the week-to-week fluctuations and it increases statistical precision.
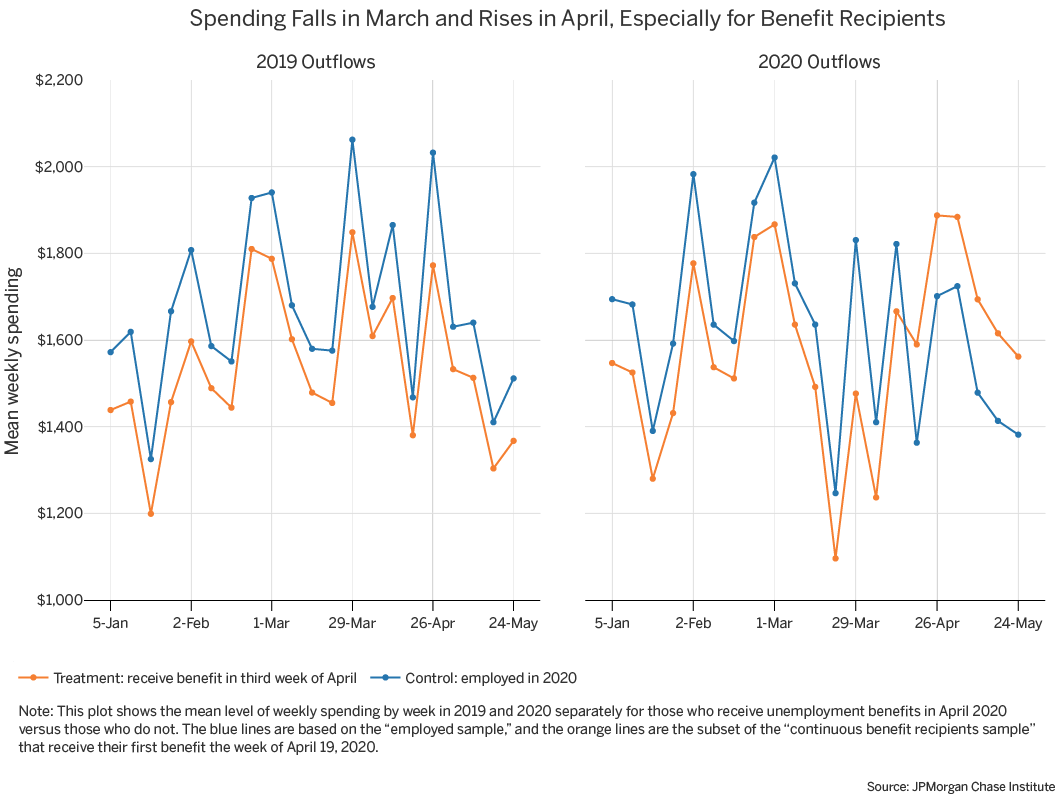
In Figure 1, we examine the path of spending for April 2020 UI recipients compared to those who remained employed during this period.[5] It shows that everyone’s spending declines in April as a result of the pandemic. However, unemployment is associated with a larger relative spending decline, which is then followed by a dramatic rebound once UI benefits begin. For April 2020 UI recipients, spending falls to 22 percent below pre-pandemic spending levels in the weeks prior to UI receipt. This is larger than the roughly 15 percent decline for the employed over the same time period. This pattern is reversed once UI benefit payments begin. In the weeks after UI receipt begins, spending of UI recipients actually rises above pre-pandemic levels by roughly 10 percent, while the spending of the employed remains about 10 percent below pre-pandemic levels.[6]
Figure 1:
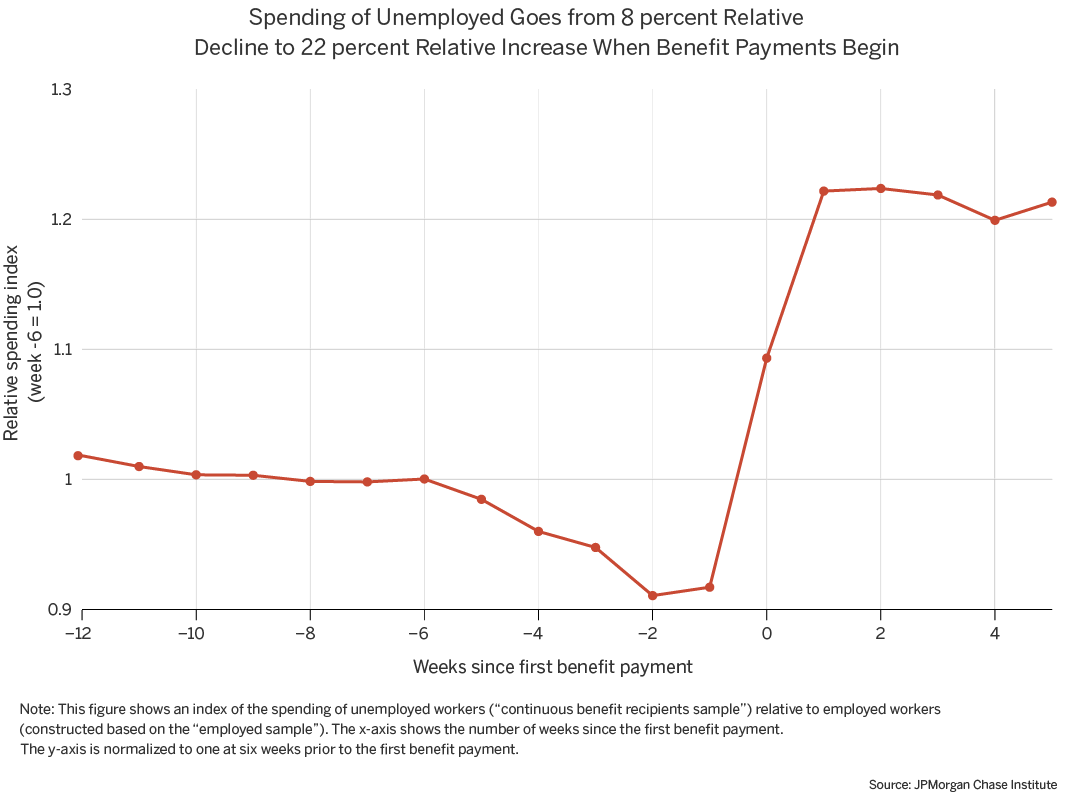
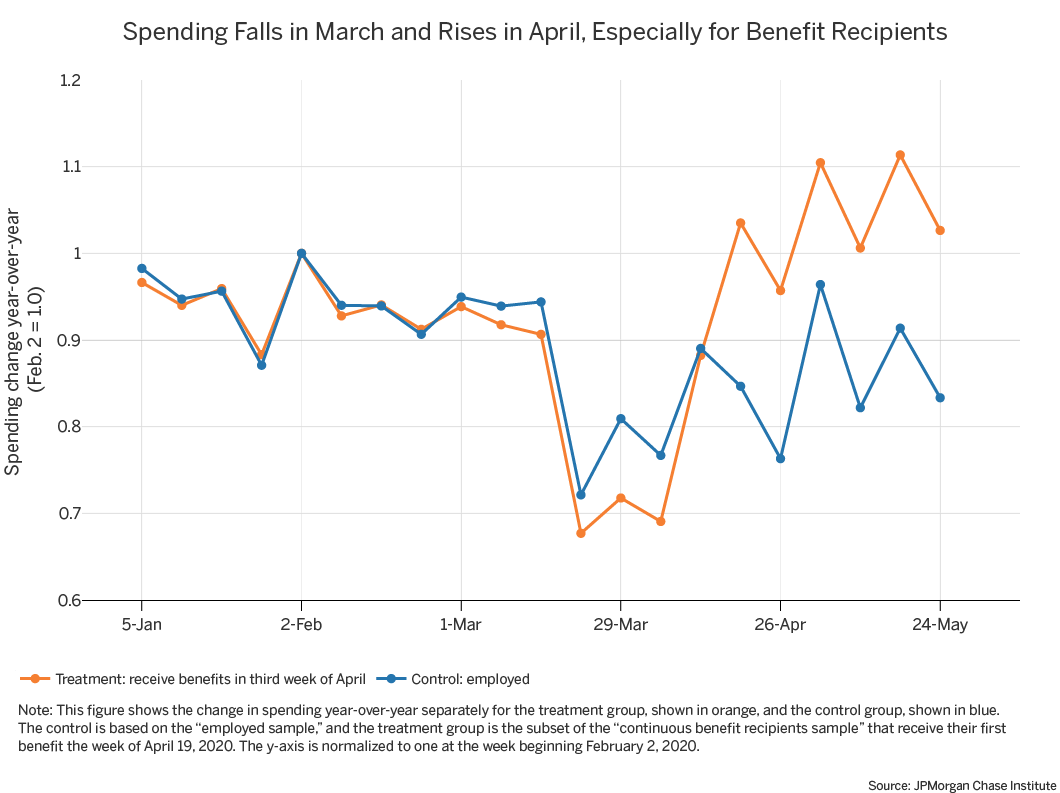
In order to sharpen the comparison in spending response between UI recipients and the employed we collapse the separate series for UI recipients and the employed in Figure 1 into a single summary index by taking the ratio of these two series. This spending index, shown in Figure 2, measures the year-over-year change in spending for UI recipients divided by the year-over-year change in spending for the employed.[7] The spending index of UI recipients falls to 0.92 before UI benefits begin and then rises to 1.22. In other words, compared to the employed, the spending of UI recipients dropped by 8 percent more during the pandemic in the weeks prior to UI benefits and then increased by 22 percent more than the employed after receiving benefits.
Figure 2:
To shed light on what drives these patterns, it is useful to compare them to relationships between spending and unemployment in more normal times. Prior to the pandemic, spending falls by about 7 percent for unemployment insurance recipients (Ganong and Noel 2019) relative to employed households.[8] Yet Figure 2 shows that during the pandemic, the unemployed exhibit a 22 percent increase in relative spending after the date of first benefit receipt. Together, these numbers suggest that households who receive unemployment benefits are spending 29 percent more during the pandemic than they would in ordinary times.
Why does the spending among UI recipients increase during the pandemic? The leading hypothesis is the $600 additional weekly payment to UI recipients, which was instituted through the FPUC of the CARES Act. In fact, it is empirically plausible that the $600 supplement could account for the magnitude of the increase in spending by UI recipients. Average weekly outflows in January and February are roughly $1,500. A 29 percent increase in weekly spending over this baseline corresponds to an additional $435 of expenditures per week, still less than the $600 weekly supplement. Thus, if the only thing that had changed between 2019 and April 2020 was the additional $600, it would make sense to interpret this as a marginal propensity to consume (MPC) out of UI benefits of $0.73 ($435/$600). While this is obviously a very strong assumption in the context of a pandemic with massive economic disruption, this estimate is nevertheless in line with other estimates of a $0.83 MPC of total bank account outflows to UI benefits in Ganong and Noel (2019).
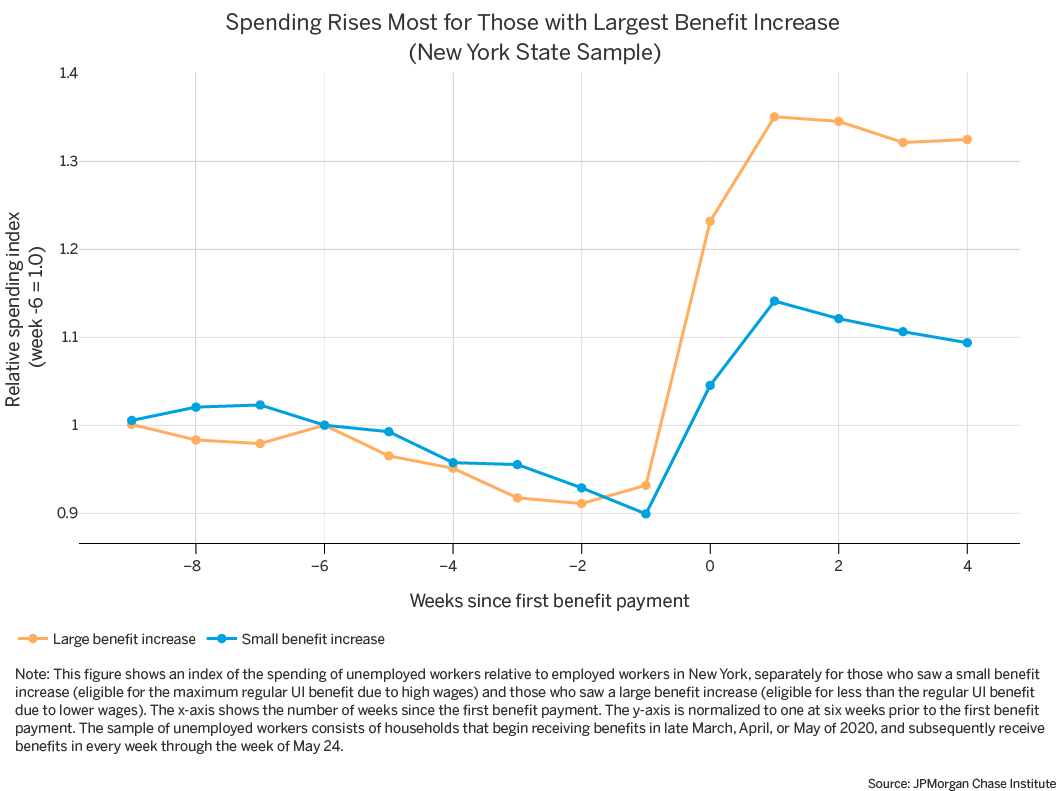
One direct piece of evidence that the $600 weekly payment is driving the consumption increase is that we find the largest consumption increase for households with the largest UI benefit increase. We stratify UI recipients in New York by whether their weekly UI benefit is equal to or is less than the maximum benefit ($504 of regular benefits, plus the $600 weekly supplement).[9] About half of UI recipients in New York receive the maximum UI benefit because they have high wages. Since the federal supplement is the same ($600), regardless of the worker’s prior wages, workers with regular UI benefits below the maximum (workers with lower wages) have larger proportional increase in UI benefits under current policy than workers with benefits at the maximum. Figure 3 shows that we find a larger consumption increase among workers who receive a larger increase in benefits from the federal supplement. Figure 3 also underscores that the UI supplement is well targeted in that it results in larger consumption growth among lower income workers.
Figure 3:
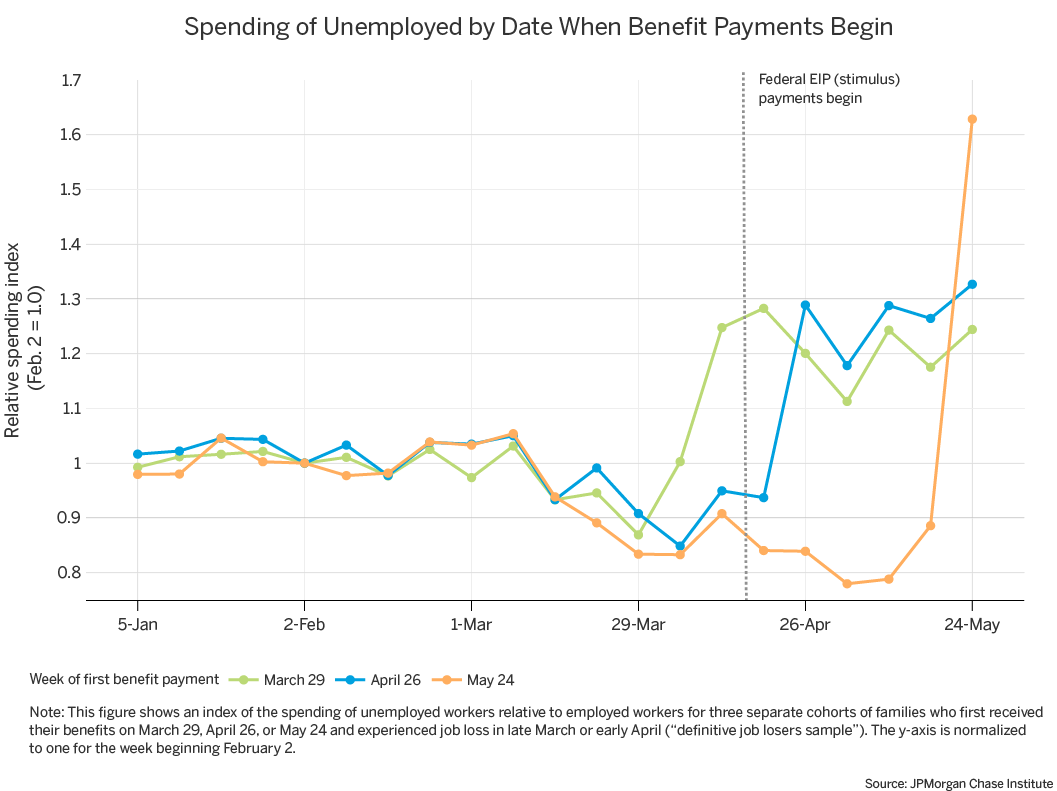
One alternative hypothesis which does not explain the spending increase around the start of UI benefits is the Economic Impact Payments (EIPs) which were issued to nearly every low- and middle-income family in the U.S. as part of the CARES Act. Figure 4 plots the relative change in spending around UI benefit receipt for three different groups of UI recipients: those who received their first UI check in the last week of March, the last week of April, and the third week of May. The figure contains a vertical line at April 15, which is when the Treasury began to issue EIPs. Ninety million payments, worth nearly $160 billion, were sent out in this week, and other studies such as Cox et al. (2020) and Chetty et al. (2020) have shown a sharp jump in aggregate spending in the week after the payments were issued. If EIPs caused a larger spending increase among UI recipients than the employed, then all three of these groups would exhibit a spending rise after EIPs are issued around April 15. However, Figure 4 shows no relative change in spending by UI recipients at this date. Thus, it appears that current and future UI recipients spent their EIPs immediately to the same extent as the employed. Consequently, EIPs do not explain why the spending of the unemployed is higher during the pandemic than during more normal times.
Figure 4:
However, we caution that there are at least two reasons why initial spending changes in response to UI benefit receipt may not capture the MPC out of ongoing $600 weekly supplements. First, some of the initial spending spike after UI benefits begin may reflect “catch up” spending to make up for depressed spending during the time spent waiting to receive UI benefits. As of now, there is little evidence that catch up spending has a meaningful effect on our estimates. Figure 4 shows that the level of spending remains elevated in May for people who received their first UI benefit payments at the end of March. However, we need additional months of spending data before we can fully understand the role of catch up spending.
Second, the spending response to unemployment is driven in part by expectations about the duration of unemployment. Economic theory suggests that households will cut spending less if they expect unemployment to be brief, while they will cut spending more if they expect unemployment to be prolonged. They will also cut spending more if they believe that their new job will not pay as much as their old job. We do not have a way to measure expectations of the unemployed and there are conflicting signals from other available evidence. On one hand, an unusually large share of the unemployed in April and May reported in the Current Population Survey that they were on temporary layoff and expected to return to their prior job. On the other hand, for workers who do not return to their prior job, either because they were permanently laid off or because their expectations that their layoff would be temporary proved incorrect, it would be reasonable for workers to expect to be jobless for much longer in 2020 than in 2019 (when the economy was booming).
Our analysis in Finding 1 indicates that the UI system has been effective at supporting consumption for those who have already received benefits, but what about the spending of those who are waiting to get benefits?
In normal economic times, there is a lag of a few weeks between when a worker receives their last paycheck and when a worker receives their first UI benefit payment. Thus, the date of the first receipt of UI benefits is a reasonably good proxy for the date of job loss. However, state UI benefit agencies have been slow to process claims and issue benefits (Stettner and Novello 2020). Although media reports have noted long delays in receipt of UI benefits, we are unaware of any quantitative estimates of the number of weeks payment is delayed at the worker level or economic consequences of such delays.
Figure 4 in the previous section shows that relative spending of the unemployed declines similarly in March, regardless of whether payment of UI benefits begin in March, April, or May. Notably, the average spending of households who do not receive UI benefits until the end of May has already declined by 15 percent relative to employed households by the end of March, which is eight weeks prior to UI benefit receipt. Relative spending then declines further in April. Cajner et al. (2020) show that the bulk of job losses occurred during the end of March. Taken together, these facts suggest the possibility that some households lost their jobs in March and cut spending while waiting for UI benefits. However, the analysis in Figure 4 of spending for workers who receive their first UI check at the end of May mixes two groups: (a) those who lost their jobs in March and waited an unusually long time for benefits and (b) those who lost their jobs in April or May and received benefits in a more timely fashion.
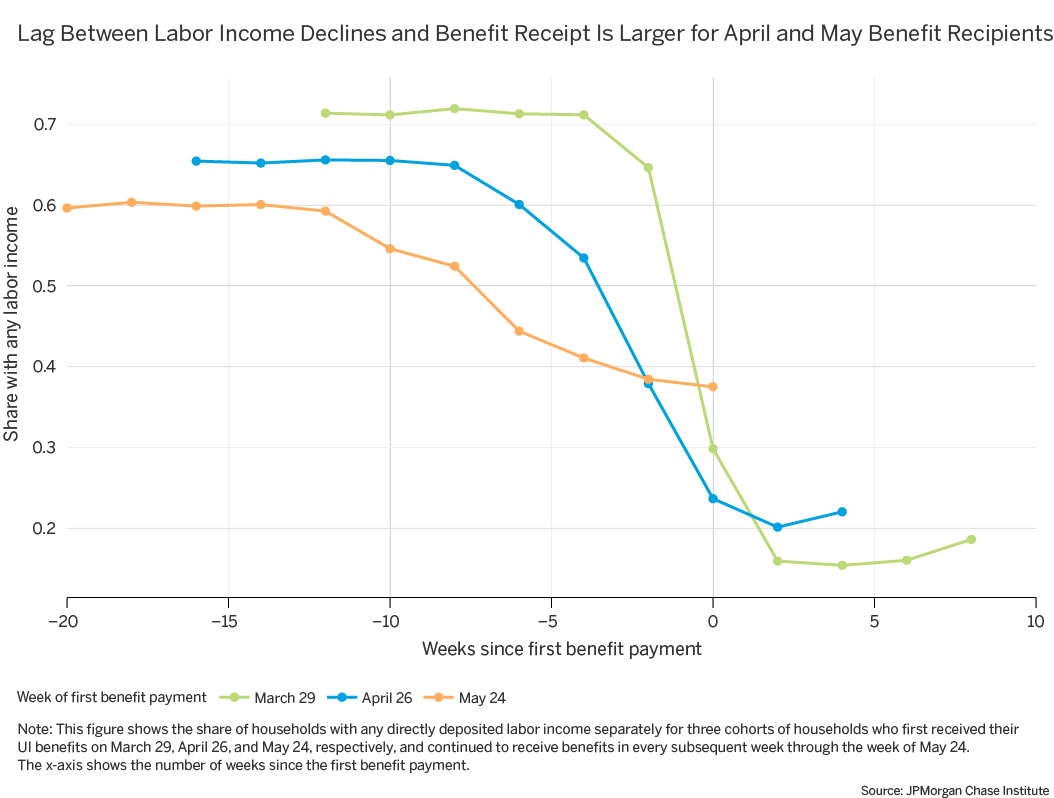
To measure the extent to which the May UI benefit cohort reflects delayed payments after job loss, we examine the share of households with any labor income in the weeks prior to UI receipt. Unsurprisingly, the share of households with any labor income declines sharply around the beginning of UI benefits, but this decline begins earlier relative to the date of the first UI payment for households who did not receive their benefits until the end of May (Figure A3 in the Appendix).[10]Specifically, the share of households with any labor income declines for two weeks prior to UI receipt for the cohort of households who first receive their benefits on March 29, four weeks prior to receipt for the April 26 cohort, and six weeks for the May 24 cohort. We conclude that at least some of the May 24 UI cohort received their last paycheck six weeks before the first UI payment.
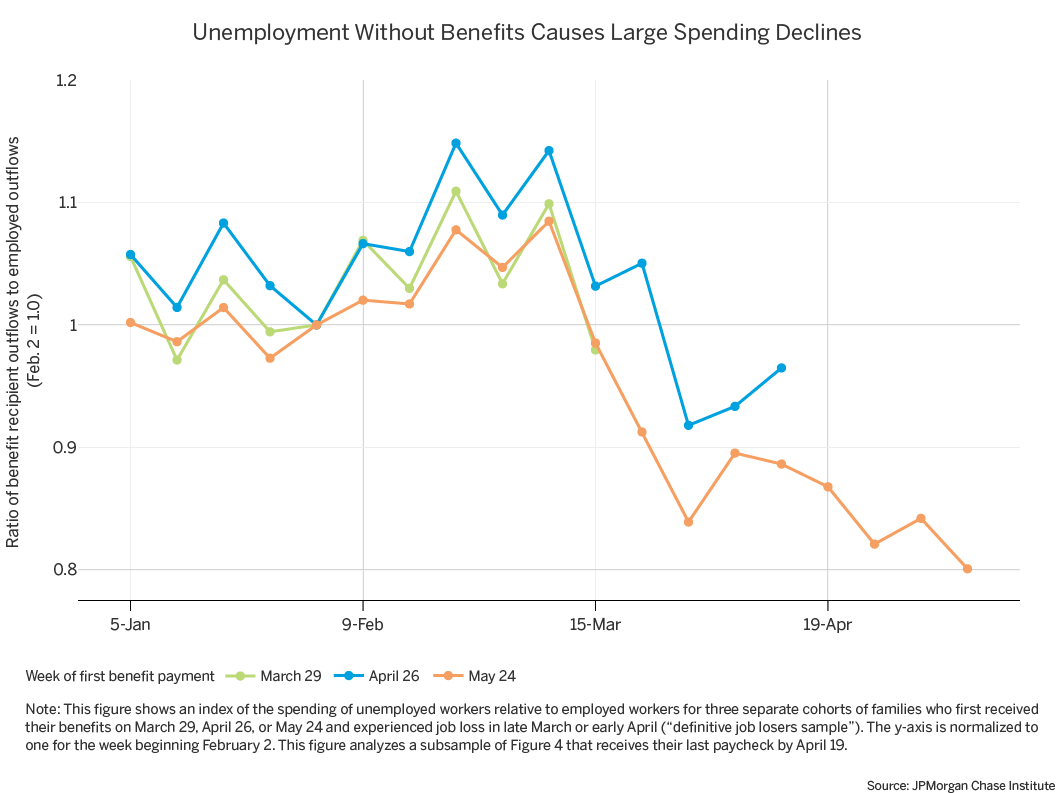
To understand how UI payment delays affect spending, we study a group of households who lost a job at the same time and received their first UI payment at different times. Specifically, we study households who receive their last paycheck during late March or early April.[11] We focus on this time period because it is when the labor market experienced the most rapid deterioration. We then analyze spending for three sub-groups: workers who received their first UI payment on March 29 (so that there was no pause between labor income and UI benefits), workers who received their first UI payment on April 26 (so that there was a pause of a few weeks), and workers who received their first UI payment on May 17 (so that there was a pause of several weeks).
Spending declines markedly for the households that have a substantial lag between receipt of their last paycheck and UI benefit receipt. Figure 5 shows the evolution of spending for the three groups that receive UI benefits at different dates. For each additional week of delay in starting UI benefits, spending falls by about 2.25 percent.[12] Thus, for the group that does not receive UI benefits until May 24, spending has fallen by about 20 percent. Although we do not yet have evidence on what categories of spending households cut while waiting for UI benefits to arrive, a 20 percent decline in spending is consistent with a substantial increase in hardship (Ganong and Noel 2019).
Figure 5:
Results presented here inform the effects of expanded unemployment insurance benefits during the current pandemic and may be useful for Congressional lawmakers as they decide whether to extend the $600 weekly UI benefit supplement, let the supplement expire, or replace it with an alternative policy. Unemployment insurance, at its current unprecedented scale and level, is not only insuring households against the hardships associated with job loss but also stimulating aggregate demand. Right now, unemployed households have increased their spending by 22 percent, relative to employed households. Prior to the pandemic, unemployed households instead cut spending by 7 percent relative to employed households. Thus, if removing the $600 benefit restored the relationship between spending and unemployment to pre-pandemic patterns, this could result in unemployed households cutting spending by 29 percent. Given that UI currently represents around 15 percent of total wages, allowing the $600 supplement to expire at the end of July 2020 could cause substantial declines in aggregate demand and potentially negative effects on the macro-economy.
If Congress is interested exclusively in consumption smoothing, then our estimates suggest that a weekly supplement to state unemployment insurance benefits less than $600 could be sufficient. What amount of UI supplement would be necessary to maintain spending by unemployed households at levels similar to those of employed households and prevent potential negative macroeconomic consequences? There are many considerations when trying ascertain what might be the right level of supplement. The relationship between unemployment and spending during the pandemic may differ for reasons besides the $600 supplement. On the one hand, unemployed households may expect to remain unemployed for longer than usual. On the other hand, unemployed households may have greater than usual liquidity as a result of EIPs, mortgage and rent forbearance, and depressed spending.[13] Additionally, the data in this paper only capture UI recipients who receive their benefits via direct deposit, while the bulk of UI benefits are paid by prepaid card. Households who receive their benefits via prepaid cards might tend to have fewer liquid assets and cut their consumption when facing unemployment to a greater extent than those who receive their UI benefits via direct deposit. The presence of all of these factors means that there is substantial uncertainty about exactly how much the unemployed will cut spending if supplemental UI benefits are not extended.
That said, some simple back-of-the envelope calculations might provide relevant reference points. We note that relative spending of the unemployed normally falls by 7 percent but instead rose by 22 percent with a $600 supplement. A simple calculation thus suggests that a $150 weekly supplement might prevent a drop in the average consumption of the unemployed relative to the employed.[14] However, during the pandemic, even employed households reduced spending by roughly 10 percent. If the government wanted to instead restore the spending of the unemployed to pre-pandemic levels, rather than just eliminate the gap between employed and unemployed households, this same calculation implies that a $350 weekly supplement would instead be needed.[15]
Even a partial restoration of pre-pandemic relationship between UI benefits and spending would imply that eliminating the $600 supplement could result in large spending cuts and thus potential negative effects on macroeconomic activity. We also note that since the marginal propensity to consume out unemployment benefits is very high, unemployment benefit supplements have a high “bang-for-the-buck”, perhaps in part because it is well targeted towards those who need help the most—those who lost their job. This can make unemployment benefits a cost effective tool for stimulating aggregate demand. Thus, a desire to increase aggregate demand during a time of unprecedented economic weakness might lead Congress to decide on a larger weekly supplement than it would choose otherwise, based on consumption smoothing motives alone.
Of course, policymakers have many other means of stimulating aggregate demand. Some of the drawbacks of UI as a stimulus tool is that high unemployment benefits can reduce the incentive for the unemployed to return to work, and, additionally, there were delays in distributing benefits. Some lawmakers, perhaps focusing on the role of UI as a social insurance program and wary of the disincentive to work, are proposing to sunset the $600 supplement, offer a return to work bonus, or provide an economic boost through a second stimulus check or other means. Indeed some combination of both expanded UI benefits and lump sum transfers may have greater macro benefit than trying to stabilize aggregate demand with either policy alone.
Setting aside the level of UI benefits, results presented here underscore the importance of making UI benefits broadly available and bolstering the UI system to process claims promptly. Although the data here are only available until the end of May, there are likely UI recipients who have experienced even longer processing delays and might therefore have experienced even larger declines in consumption than documented in this insight. Moreover, Bitler, Hoynes, and Schanzenbach (2020) document that despite eligibility expansions, many jobless workers are still not receiving UI benefits. The declines in spending for workers who are unemployed and never receive UI are likely even larger than the already-large declines for people who eventually receive UI.
Bernard, Tara Siegel. “Fraudulent Jobless Claims Slow Relief to the Truly Desperate. New York Times. July 2, 2020
Bitler, Marianne P., Hilary W. Hoynes, and Diane Whitmore Schanzenbach. “The social safety net in the wake of COVID-19.” Brookings Papers on Economic Activity. BPEA Conference Drafts, June 25, 2020.
Bivens, Josh. “Cutting off the $600 boost to unemployment benefits would be both cruel and bad economics.” Economic Policy Institute Working Economics Blog, June 26, 2020.
Cajner, Tomaz, Leland D. Crane, Ryan A. Decker, John Grigsby, Adrian Hamins-Puertolas, Erik Hurst, Christopher Kurz, and Ahu Yildirmaz. “The US labor market during the beginning of the pandemic recession.” No. w27159. National Bureau of Economic Research, 2020.
Chetty, Raj, John N. Friedman, Nathaniel Hendren, Michael Stepner, and The Opportunity Insights Team. “How Did COVID-19 and Stabliziation Policies Affect Spending and Employment? A New Real-Time Economic Tracker Based on Private Sector Data.” No. w27431. National Bureau of Economic Research, 2020.
Cox, Natalie and Ganong, Peter and Noel, Pascal and Vavra, Joseph and Wong, Arlene and Farrell, Diana and Greig, Fiona. “Initial Impacts of the Pandemic on Consumer Behavior: Evidence from Linked Income, Spending, and Savings Data,” University of Chicago, Becker Friedman Institute for Economics Working Paper No. 2020-82, June 22, 2020.
Federal Reserve Board. “Report to the Congress on Government-Administered, General-Use Prepaid Cards - September 2019.” Board of Governors of the Federal Reserve System.
Ganong, Peter, and Pascal Noel. "Consumer spending during unemployment: Positive and normative implications." American Economic Review 109, no. 7 (2019): 2383-2424.
Ganong, Peter, Pascal J. Noel, and Joseph S. Vavra. “US Unemployment Insurance Replacement Rates During the Pandemic.” No. w27216. National Bureau of Economic Research, 2020.
Goodman, Peter S., Patricia Cohen, and Rachel Chaundler. European Workers Draw Paychecks. American Workers Scrounge for Food. New York Times, July 3, 2020.
Stettner, Andrew, and Amanda Novello. “Unemployment Payouts Accelerated during April and May—but Are Still Too Slow.” 2020 The Century Foundation.
Figure A1:
Figure A2:
Figure A3:
We thank Samantha Anderson, Therese Bonomo, Erica Deadman, Bernard Ho, Robert McDowall, Marilyn Newman, Tanya Sonthalia and Sruthi Rao. We also thank colleagues at the JPMorgan Chase Institute and Gabriel Chodorow-Reich for their comments and suggestions. All statistics from JPMCI data, including medians, reflect cells with multiple observations. The opinions expressed are those of the authors alone and do not represent the views of JPMorgan Chase & Co.
Diana Farrell, JPMorgan Chase Institute, President & CEO
Peter Ganong, Assistant Professor at the University of Chicago Harris School of Public Policy
Fiona Greig, JPMorgan Chase Institute, Director of Consumer Research
Max Liebeskind, JPMorgan Chase Institute, Consumer Research Associate
Pascal Noel,Neubauer Family Assistant Professor of Finance at the University of Chicago Booth School of Business
Joe Vavra, Professor of Economics at the University of Chicago Booth School of Business
JPMorgan Chase & Co.'s website terms, privacy and security policies don't apply to the site or app you're about to visit. Please review its website terms, privacy and security policies to see how they apply to you. JPMorgan Chase & Co. isn't responsible for (and doesn't provide) any products, services or content at this third-party site or app, except for products and services that explicitly carry the JPMorgan Chase & Co.